Chapters


Covariance Definition
| Definition | Example | |
| Covariance | Calculation of how the means of two variables move together | If the price of bread increases, the price of jam also increases |
Covariance can be either positive or negative. The table below summarizes how you can interpret variance.
| Covariance | Interpretation |
| Positive | Two variables move in the same direction |
| Negative | Two variables move in opposite directions |
Covariance is a statistic that is often used in finance. This is a result of its ability to reliably measure whether two stocks will move in the same direction.
Covariance Formula
Recall that in statistics, you have a population and a sample. The differences between the two are listed in the table below.
| Population | Sample | |
| Definition | Includes all the things you want to measure | Is a subset of the population you want to study |
| Example | All the posts on a social media platform | A sample of 5,000 posts on a social media platform |
| Size | Usually very large because it includes all the things you want to study | Relatively smaller than the population, should be representative of the population |
| Measures | Population parameter | Sample statistic |
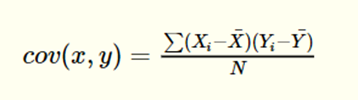
In this case, we have two formulas for the covariance. The formula for the population covariance is:
The sample covariance, on the other hand, is calculated as below.
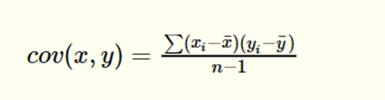
The variables in the formula are explained in the table below.
| Variable | Description |
 | The ith value of x (for example, the 2nd measured value of x) |
 | The ith value of y corresponding to the ith value of x |
 | The sample mean of x |
 | The sample mean of y |
| n | The sample size |
Covariance versus Correlation
Many people get a bit confused on the differences between covariance and correlation. Recall that the correlation coefficient is a measure of the strength of a linear relationship between two variables. The table below summarizes both.
| Equation | Definition | Example | |
| Correlation |  | The measure of the strength of the linear relationship between two variables | The correlation between rain and tourism is strong |
| Covariance |  | Direction two variables move with each other | The covariance between rain and tourism is negative, meaning as rain goes up tourism goes down |
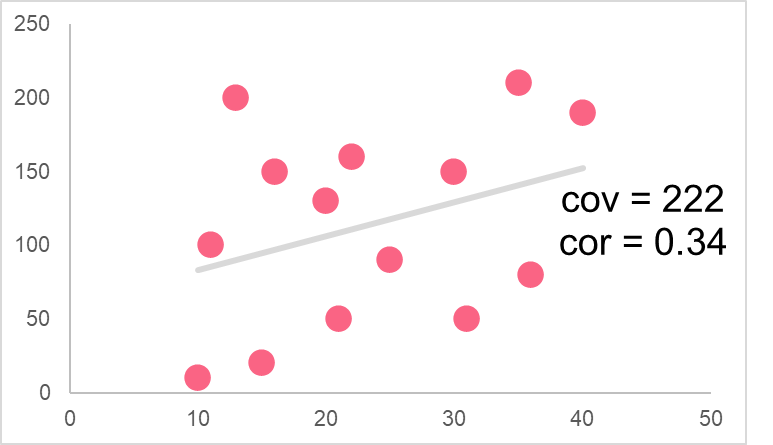
The correlation of a variable can also tell us the direction of movement of two variables. For example, if there is a negative correlation, it indicates the same thing as a negative covariance: as one variable moves, the other variable moves in the opposite direction. However, the main difference is that the correlation tells us about the strength of the relationship. While we may know that two variables move in opposite directions with the covariance, we cannot tell how strong this relationship is.
The correlation, on the other hand, can give us an idea if the relationship between two variables is weak or strong.
Problem 1
The following data set is from a bicycle company. The company is interested in understanding the relationship between their bike sales and the amount they’ve spent on ads around the city. Given the following data set, calculate the covariance using the formulas provided earlier in this section. Then, interpret the graph provided using the covariance you have calculated.
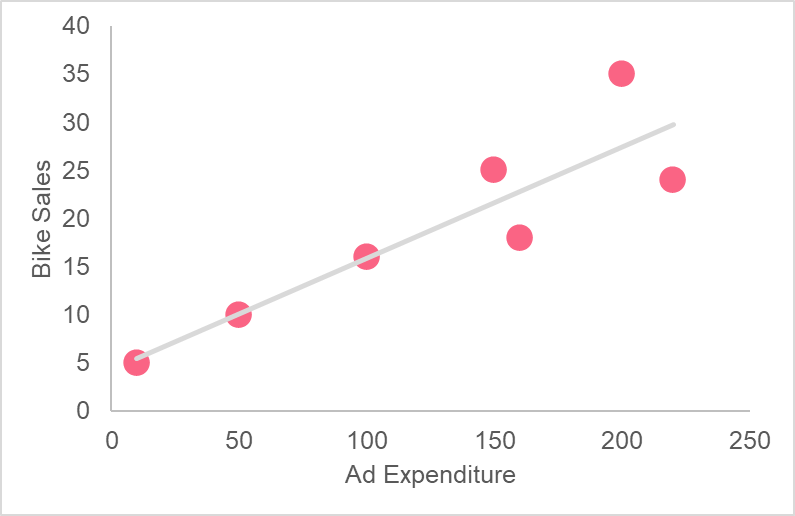
| Bike Sales | Ad Expenditure |
| 5 | 10 |
| 10 | 50 |
| 16 | 100 |
| 18 | 160 |
| 25 | 150 |
| 35 | 200 |
| 24 | 220 |
Solution to Problem 1
Recall that there are two possible formulas we can use to calculate the covariance. Since we do not have data on all of the bikes ever sold by the company, we need to use the sample covariance.
The first thing you will need to do is calculate the mean of both variables, which is done below.
\[
bar{x} = \dfrac{10+50+100+160+150+200+220}{7} = 127
\]
\[
bar{y} = \dfrac{5+10+16+18+25+35+24}{7} = 19
\]
Next, you will have to subtract this mean from each variable and then multiply these two subtracted values together.
 |  |  |
| -14 | -117 | 1640 |
| -9 | -77 | 694 |
| -3 | -27 | 81 |
| -1 | 33 | -33 |
| 6 | 23 | 137 |
| 16 | 73 | 1166 |
| 5 | 93 | 464 |
| Total | 4150 |
Next, plug it back into the equation
\[
cov(x,y) = \dfrac{4150}{7-1} = 692
\]
Since the covariance is positive, we can say with certainty that ad expenditure and bike sales move together. As ad expenditure increases, so do bike sales.
Problem 2
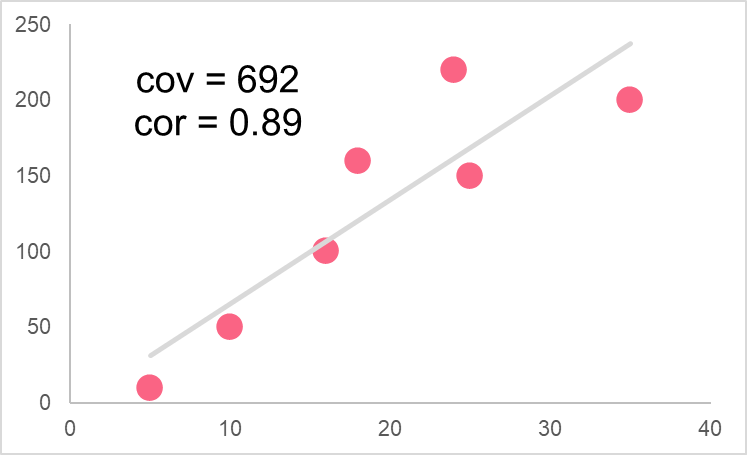
Given the following graph, interpret the relationship between the two variables given. Next, describe the difference between the covariance and correlation.
Solution to Problem 2
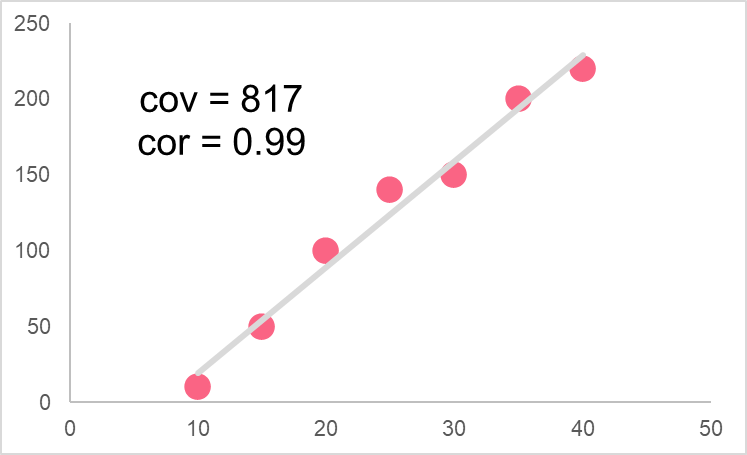
In order to interpret the graph, let’s take a look at the covariance and correlation.
- Covariance: 692
- Correlation: 0.89
The first thing we notice is that they both have the same sign: both are positive. The covariance and correlation of two variables will always have the same sign, as the correlation is simply the covariance divided by the multiplied standard deviations of x and y. Since the standard deviation is always positive, we can see how the covariance determines the sign of the correlation coefficient.
This means that both numbers can tell us about the directional relationship simply by knowing whether they are positive or negative. The difference between covariance and correlation, however, is that the correlation can also tell us how strong this directional relationship is. These two variables have a correlation coefficient of 0.89, which is a very high correlation. Therefore, we can say that not only do these variables move in the same direction, but that this movement is highly predictable.
Did you like this article? Rate it!


