Chapters
Multiple linear regression is one of the most powerful tools in statistics - however, it can often be a difficult concept to put into practice. To understand the underlying concepts behind multiple linear regression, try solving the following problem by first reviewing the preceding problem dealing with the basics of MLR. Use this guide if you are unsure how to approach this problem or are encountering these concepts for the first time.


Problem 5
In the last problem (Solution to Problem of Regression 5), you were asked to build a multiple regression model based on the given data set. Now that you have the multiple regression model, interpret what these results mean. Next, see what would happen to the interpretation of your results if you transformed the variable of salary amount into logarithms.
What is MLR?
Recall that multiple linear regression, or MLR, is simply the extension of simple linear regression. Instead of analysing how one explanatory variable explains the variation in one response variable, MLR uses two or more explanatory variables to analyse a single response variable. More predictors lead to higher explained variance, or R squared.
This R squared value is known formally as the coefficient of determination, which should not be confused with the correlation coefficient. The correlation coefficient is a statistic that measures the strength of the linear relationship between two variables. The coefficient of determination, on the other hand, is a statistic that measures how much variation in the response variable can be explained by the explanatory variables. Hence the name “explanatory” variables.
The R squared value ranges between 0 and 1, whose formula is the following.
[
rho_{xy} = frac{Cov(x,y)}{sigma_{x} sigma_{y}}
]
Multiple linear regression is important to statistics because, in the majority of cases, people are more interested in studying more than one independent variable. Because MLR models are more complex, this also means that they can lead to a higher degree of bias or variance. Keep this in mind whenever you’re building an MLR model.
MLR Explained
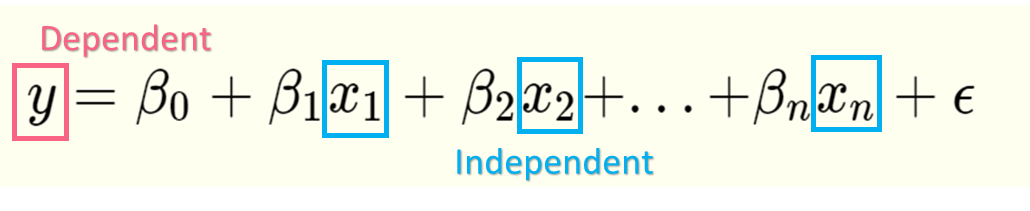
Recall the formula for multiple linear regression, which is the following.
[
y = beta_{0} + beta_{1}x_{1} + beta_{2}x_{2} + … + beta_{n}x_{n}
]
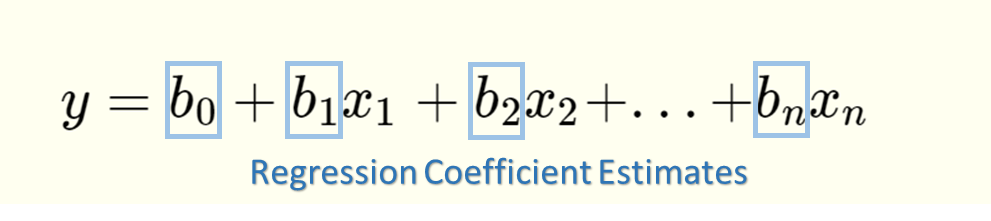
This formula pertains to the population. However, because we rarely ever have population data, we have to estimate it using a sample from the population. Naturally, this means we also have to estimate the true MLR equation. The estimated MLR equation is:
[
hat{y} = b_{0} + b_{1}x_{1} + b_{2}x_{2} + … + b_{n}x_{n}
]
The interpretation of these values can be found below.
| Element | Description |
 | The estimates of the population parameters  |
 | The estimate of the parameter  |
 | The values corresponding the first, second and  th independent variables either from our sample or outside of our sample th independent variables either from our sample or outside of our sample |
MLR Estimators
Recall that the estimators in the MLR estimation equation can be calculated by hand. While the intercept is easy to calculate, the other estimators can be a bit tricky. To find the equation for the intercept, you simply need to rearrange the MLR equation. To understand these formulas, let’s take a MLR formula with just two independent variables.
[
hat{y} = b_{0} + b_{1}x_{1} + b_{2}x_{2}
]
| Element | Formula |
 |  |
 |  |
 |  |
 |  |
 |  |
 |  |
 |  |
MLR Interpretation
MLR interpretation is quite simple. Let’s start with an example.
[
hat{y} = 1,000 + 15,000x_{1} + 20,000x_{2}
]
Where the variables are the following.
| Variable | Variable Type | Description |
 | Dependent variable | Sales in units |
 | Independent variable | Investment in pounds |
 | Independent variable | Advertising in pounds |
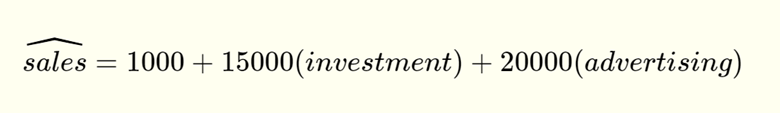
For the independent variables, the coefficients, which are 15,000 and 20,000 respectively, are always interpreted in the following manner:
Given a one unit change in the independent variable, the regression coefficient is the corresponding change in y, all other variables held constant (ceteris paribus).
In this example, this means that an increase of 1,000 pounds in investment will lead to a 15,000 unit increase in the sales when advertising expenditures are held constant. Keep in mind that constant does not mean zero, just that there is no change either by an increase or decrease.


The intercept, on the other hand, is only meaningfully interpreted when all independent variables can be zero. Sometimes this is obvious, for example with an MLR dealing with a dependent variable height and independent variable weight, it will be impossible for a weight of zero to result in a non-zero height.
On the other hand, in our example, it is entirely possible for either investing or advertising to be zero. Here, the y-intercept is the amount of sales when both investment and advertising are zero pounds.
However, you won’t always have x and y values in your equation that are linear. Take a look at the table below for the different interpretations for each equation.
| Model Type | Model | Dependent | Independent | Interpretation |
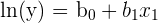 | Log-linear | ln(y) | x | An 1 unit increase in x will lead to an increase of (100* )% in y |
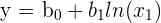 | Linear-log | y | ln(x) | An 1 unit increase of x will lead to an increase of (/100) units in y |
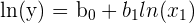 | Log-log | ln(y) | ln(x) | An 1% increase of x will lead to a ()% in y |
MLR Interpretation problem
In the last problem, you were asked to build a multiple regression model on the dataset involving salary, education and experience. Now, you’re being asked to interpret the regression coefficients and say what you think would happen if the variables were in logarithms.
Let’s start with the first task. Recall that the equation for the dataset was:
[
salary = -4051 + 2560(education) + 168(experience)
]
First, look at the y - intercept. Normally, the y-intercept would be the value of y when all other variables, meaning education and experience, are zero. However, recall that the interpretation of y only makes sense in the context of the data set and what you know about real-life situations. Would having zero education or zero years of work experience be likely? While it does happen, it can be extremely rare.
When in doubt - look at your dataset. Does the range of the x or y values include zero? Combining common sense and information from the data, we can assume that the y-intercept here is meaningless in terms of the interpretation.
Next, let’s look at the first independent variable: education. Remember that the regression coefficients of the independent variables represent the slope in terms of the y value. This means that, when experience is held constant, one more year of education results in 2560 more pounds in salary. This is important, because it means that when we control for experience, people with more education make more money.
Finally, let’s delve into the second independent variable: experience. Following the same logic, one more year of work experience, education held constant, results in an 168 pound increase.
Did you like this article? Rate it!


