Chapters


What is Probability Theory?

| Type | Definition | Example |
| Descriptive | Analyses within the data set | Calculating the mean of a variable |
| Inferential | Uses the data to analyse what is outside the data set (predictions) | Creating a regression model using several variables |
In order to make predictions about the future, we can use the probability or probability distribution of a variable to make statistical inferences. The use of this probability is split into two different camps: Bayesian and frequentist.

| Type | Definition |
| Bayesian | Assigns a probability to a hypothesis |
| Frequentist | Does not assign a probability to a hypothesis |
Event
In order to understand probability, it is important to first make sure you have a deep understanding of the building blocks of probability. Everything in probability deals with the concepts of random variables and events.
| Concept | Definition | Example |
| Random Variable | A variable whose outcomes are not certain | Rain |
| Event | One or more set of outcomes | It rains |
Let’s continue from the example in the table and take the random variable of rain. This is a random variable because one can never be 100% certain that it will rain on a given day.
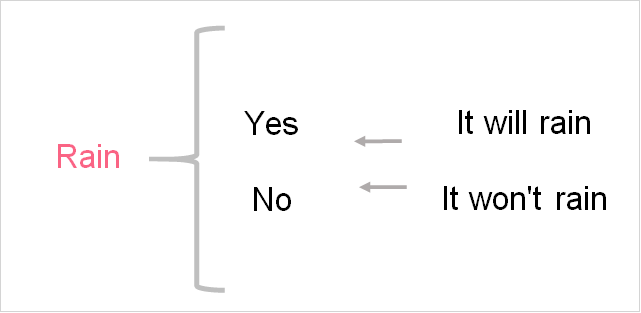
There are only two possible outcomes for this random variable, which are: yes, it will rain and no, it won’t rain. Notice that the random variable of rain is written as a capital letter. This is the standard way to write a random variable.

One possible event for R is yes, which we write as E(Y). This is pretty straight forward: the event that it rains is yes, or Y.
Sample Space
As you can probably tell, the field of probability may have a lot of fancy jargon but the concepts are actually quite simple. The sample space is another example of this: it is simply the set of all possible outcomes of a random variable.
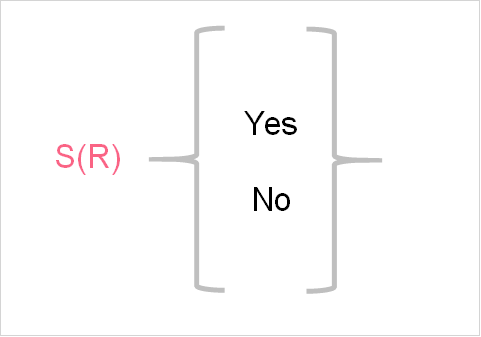
Continuing from the example above, the rain random variable has a sample space of 2 outcomes: yes and no. Take a look at the table below to get some more examples of sample spaces for random variables.
| Random Variable | Notation | Sample Space |
| Coin Toss | C | S(C) = {H,T} |
| Acceptance Rate | A | S(A) = {A,NA} |
| Dice Roll | D | S(D) = {1,2,3,4,5,6} |
Independent Event
To build upon what has been said so far, the probability of an event is the likelihood of that event happening. The first step in calculating the probability of one or more events is to decide what type of event it is. In probability, there are generally two types of events: independent and dependent events. Independent events are defined as those whose probability is not affected by the outcome of another event.
| Description | Example | |
| Independent event | Two events can happen at the same time, whose probabilities do not affect each other | Rolling a dice where: Event A - landing on 2 Event B - landing on an even number |
| Mutually exclusive event | Two events can happen at the same time, whose probabilities do not affect each other | Picking a card out of a deck where: Event C - picking an ace of spades Event D - picking an ace of hearts |
A special type of independent event is called a mutually exclusive event, which is when two events cannot happen at the same time. The examples in the table above describe how these two events are different. Event A and B can happen at the same time when the dice lands on 2, because it is the number 2 and even at the same time.
On the other hand, when picking out a card from a deck, it is impossible to pick one card and for it to be an ace of hearts and an ace of spades at the same time.
Dependent Event
A dependent event is an event whose probability is affected by the outcome of another event. The simplest example to remember when you want to recall the difference between an independent and a dependent event is described in the table below.
| Definition | Example | |
| Independent | Probability is not affected by the outcome of another event | Selection with replacement |
| Dependent | Probability is affected by the outcome of another event | Selection without replacement |
The picture below shows how the probabilities of independent and dependent events are different.

Probability Equation
Recall that the probability of an event is the likelihood of that event happening. Because probabilities can change depending on the type of event, there are different equations for probability. The table below summarizes the most common probability equations.
| Equation | |
| Simple probability |  |
| P(A and B), independent | P(A) * P(B) |
| P(A and B), dependent | P(A) * P(B|A) |
Take the previous example, which dealt with the probability of picking the number 2 out of three cards. The first situation, with replacement, is an example of two independent events.
\[
P(pick \; 2 \; AND \; pick \;2) = \frac{1}{3} * \frac{1}{3}
\]
On the other hand, picking without replacement means that the second time we pick, the probability will depend on which card we pick in the first round. This is why the second probability is the probability of B given A. Say we pick a card that is not two.
\[
P(pick \; 2 \; AND \; pick \; 2) = \frac{1}{3} * \frac{1}{2}
\]
Probability Distribution
Probability distributions are functions or visualizations that tell us the probability of each value, or event, occurring for a variable. The most common types of probability distributions are:
- Normal or Standard Normal
- Binomial
- Poisson
The probability of these distributions is not like the probabilities for events. Each probability distribution requires a different method to find the probability of an event. The table below summarizes this information.
| Distribution | Parameters | Probability |
| Standard normal | Mean =  , SD = , SD =  | z =  , probability found on z-table , probability found on z-table |
| Binomial | n = # of trials, p = probability of success in each trial, q = 1-p |  |
| Poisson | Mean =  | P =  |
What Probability Distribution to Use
Knowing when to use which probability distribution can be confusing sometimes. The table below is meant to be used as a guide in order to help you decide which probability distribution to employ in which situations.
| When to Use | |
| Standard normal | When the distribution of the variable follows a normal distribution |
| Binomial | When the variable has only two outcomes (success or failure, yes or no, 1 or 2, heads or tails, etc.) |
| Poisson | When the variable is in terms of time intervals (calls per hour, customers per day, etc.) |
Probability Example
Take the following table as an example, where we’re interested to know the probability of picking the colour red twice with and without replacement. When calculating without replacement, say that the first pick is red.
| Colour | Frequency |
| Red | 3 |
| Blue | 2 |
With replacement,
\[
P(R \; and \; R) = \frac{3}{5} * \frac{3}{5}
\]
Without replacement,
\[
P(R \; and \; R) = \frac{3}{5} * \frac{2}{4}
\]
Did you like this article? Rate it!


Using facebook account,conduct a survey on the number of sport related activities your friends are involvedin.construct a probability distribution andbcompute the mean variance and standard deviation.indicate the number of your friends you surveyed
this page has a lot of advantage, those student who are going to be statitian
I’m a junior high school,500 students were randomly selected.240 liked ice cream,200 liked milk tea and 180 liked both ice cream and milktea
A box of Ping pong balls has many different colors in it. There is a 22% chance of getting a blue colored ball. What is the probability that exactly 6 balls are blue out of 15?
Where is the answer??
A box of Ping pong balls has many different colors in it. There is a 22% chance of getting a blue colored ball. What is the probability that exactly 6 balls are blue out of 15?
ere is a 60% chance that a final years student would throw a party before leaving school ,taken over 50 student from a total of 150 .calculate for the mean and the variance
There are 4 white balls and 30 blue balls in the basket. If you draw 7 balls from the basket without replacement, what is the probability that exactly 4 of the balls are white?