Chapters


Measures of Central Tendency
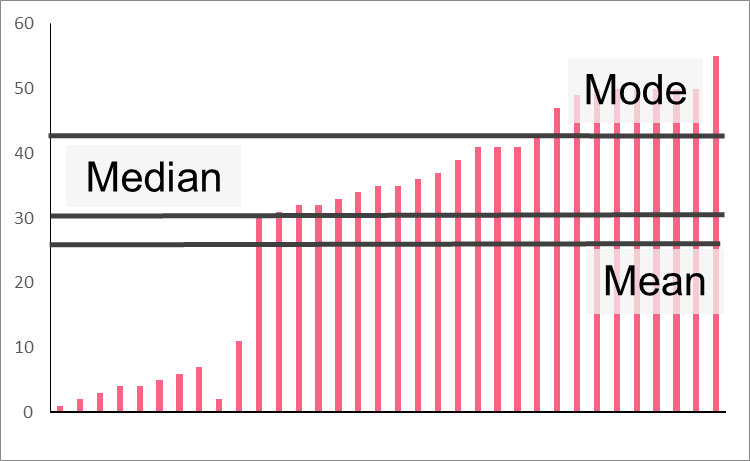
As you can see in the image above, measures of central tendency are those that involve the centre of the data. It is important to remember that there is not one single number that can capture the centre perfectly, especially in cases of skewed distributions.
Measures of Spread
Measures of spread are distinct from measures of central tendency. While measures of central tendency seek to describe the centre, measures of spread aim to describe the distribution of the data around the centre.
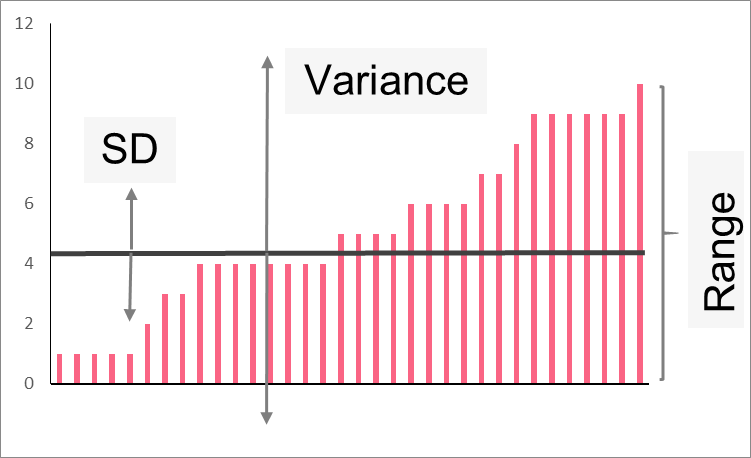
As you can see, there are three common measures of spread: standard deviation, variance and range. Measures of spread are equally as important as those of the centre and, in fact, should be reported along with metrics like mean or median. This is because understanding the distribution of the data is vital to any analysis.
Standard Deviation Definition
The standard deviation is defined as the spread of the data relative to the data’s mean. Standard deviation is one of the most powerful tools in statistics, especially when it comes to normal distributions. Take a look at a standard normal distribution below.

As you can see, the mean has been standardised and is located at zero. This makes sense, as a mean is zero standard deviations from itself. Converting all other numbers in the dataset to standardized numbers, we can easily see how many standard deviations away that particular number is from the mean. In the image, as in real life, the more standard deviations a number is from the mean, the further away it is from the mean.
Standard Deviation Formula
There are two ways you can calculate the standard deviation. Let’s take a look at the standard deviation formula, which is the first way you can calculate the standard deviation.

| Element | Description |
 | The ith point of the data set |
 | The sample mean |
| n | The sample size |
While you can calculate it this way, you can also take a short-cut if you happen to have the variance. The standard deviation is the square root of the variance - so simply take the square of the variance if you have it.
Standard Deviation Interpretation
As you can see in the formula, we subtract the sample mean from every single value in the data set. This gives us, in raw numbers, how far each observation is from the mean. Next, these values are squared in order to get rid of the effect of negative numbers.
Think about it - say you have a mean test score of 80 and someone scores 60 points. They are 20 points below, or -20 points away from, the mean. If we added this to the difference of someone who scored 100 points, which is 20 points above the mean, they would simply cancel each other out. Instead, we square the differences in order to preserve the magnitude.
Next, we divide it by the sample size minus one, which gives us approximately the average amount of deviation from the mean, squared. Taking the square root let’s us get approximately the average spread from the mean. The higher the standard deviation, the farther spread the data points are from the mean.
Problem 1
You’re interested in calculating the standard deviation of the exam scores of a national standardised test to see if many people scored close to the mean or not. Use the following dataset.
| Test Taker | Score |
| 1 | 20 |
| 2 | 40 |
| 3 | 60 |
| 4 | 60 |
| 5 | 75 |
| 6 | 80 |
| 7 | 70 |
| 8 | 65 |
| 9 | 70 |
| 10 | 90 |
Solution 1
In order to solve for the standard deviation, we have to follow the formula given earlier. Take a look at the solution below.
| Test Taker | Score |  |  |
| 1 | 20 | -43 | 1849 |
| 2 | 40 | -23 | 529 |
| 3 | 60 | -3 | 9 |
| 4 | 60 | -3 | 9 |
| 5 | 75 | 12 | 144 |
| 6 | 80 | 17 | 289 |
| 7 | 70 | 7 | 49 |
| 8 | 65 | 2 | 4 |
| 9 | 70 | 7 | 49 |
| 10 | 90 | 27 | 729 |
| 63 |  | 3660 |
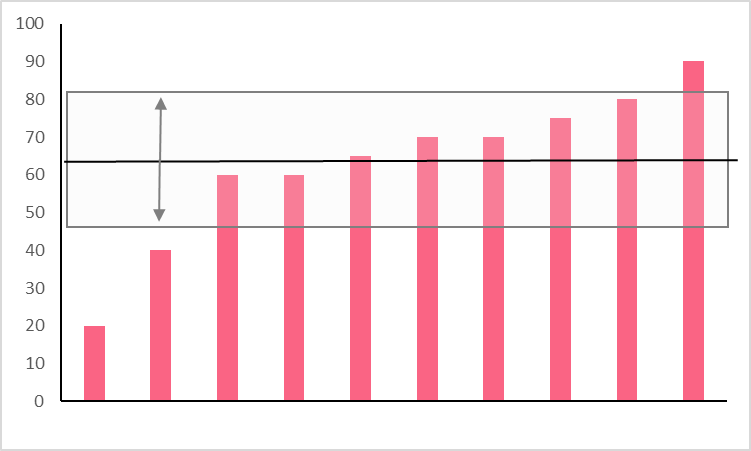
Next, we simply put it into the formula.
\[
sd = \sqrt{\frac{3660}{10-1}} = 20.2
\]
Problem 2
Let’s take the same idea as the previous example. However, this time, let’s compare it to last year’s test scores. Calculate the standard deviation and state whether the data is more or less spread than this year’s test scores.
| Last Year’s Test Taker | Score |
| 1 | 45 |
| 2 | 50 |
| 3 | 67 |
| 4 | 68 |
| 5 | 75 |
| 6 | 80 |
| 7 | 70 |
| 8 | 65 |
| 9 | 70 |
| 10 | 90 |
Solution 2
| Test Taker | Score | | |
| 1 | 20 | -23 | 529 |
| 2 | 40 | -18 | 324 |
| 3 | 60 | -3 | 9 |
| 4 | 60 | -1 | 1 |
| 5 | 75 | 0 | 0 |
| 6 | 80 | 2 | 4 |
| 7 | 70 | 2 | 4 |
| 8 | 65 | 7 | 49 |
| 9 | 70 | 12 | 144 |
| 10 | 90 | 22 | 484 |
| 68 | | 1548 |
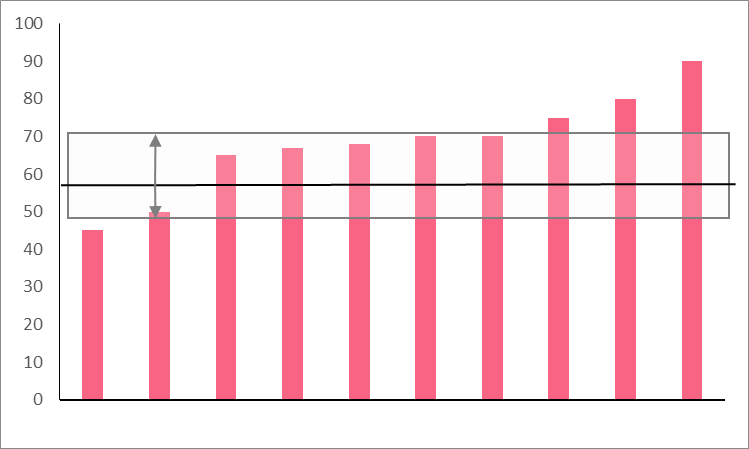
Next, we simply put it into the formula.
\[
sd = \sqrt{\frac{1548}{10-1}} = 13.1
\]
This standard deviation is lower, which means the data are less spread around the mean. The image below illustrates this.
Problem 3
You’re given the following information about the average salaries of people working in different fields. Calculate the standard deviation, then interpret what the standard deviation means in terms of each field.
| Marketing | Education | Banking | Technology | |
| Mean Salary | 30,000 | 45,000 | 80,000 | 75,000 |
| Variance | 100,000,000 | 25,000,000 | 900,000,000 | 400,000,000 |
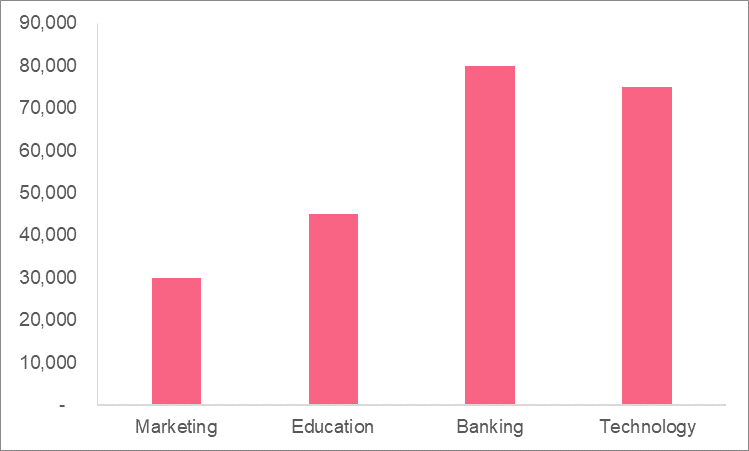
Solution 3
To calculate the standard deviation, you simply need to take the square root of the variance. This gives us the following.
| Marketing | Education | Banking | Technology | |
| Standard Deviation | 10,000 | 5,000 | 30,000 | 20,000 |
As we can see, while banking has the highest mean salary, there is a lot of variation between salaries. On the other hand, while education has a lower mean salary, there is not a lot of variation between salaries. Keep in mind that this is a fictitious data set.
Did you like this article? Rate it!


Using facebook account,conduct a survey on the number of sport related activities your friends are involvedin.construct a probability distribution andbcompute the mean variance and standard deviation.indicate the number of your friends you surveyed
this page has a lot of advantage, those student who are going to be statitian
I’m a junior high school,500 students were randomly selected.240 liked ice cream,200 liked milk tea and 180 liked both ice cream and milktea
A box of Ping pong balls has many different colors in it. There is a 22% chance of getting a blue colored ball. What is the probability that exactly 6 balls are blue out of 15?
Where is the answer??
A box of Ping pong balls has many different colors in it. There is a 22% chance of getting a blue colored ball. What is the probability that exactly 6 balls are blue out of 15?
ere is a 60% chance that a final years student would throw a party before leaving school ,taken over 50 student from a total of 150 .calculate for the mean and the variance
There are 4 white balls and 30 blue balls in the basket. If you draw 7 balls from the basket without replacement, what is the probability that exactly 4 of the balls are white?