Chapters


Measures of Central Tendency
A measure of central tendency is also known as a summary statistic and it generally represents the central point of the data set. These measures tell us where most values are located in distribution and are also known as the central location of the distribution. Sometimes the data tends to cluster around the central value. The most common measures of central tendency are mean, median, and mode. In this section, we will learn how to calculate the three measures of central tendency. We will also see which kind of data is appropriate for which type of measure.
Arithmetic Mean
The arithmetic mean is an average of all the values in the data set. It is the most popular measure of central tendency and is easier to calculate. To calculate the arithmetic mean, enumerate all the values in the data set and divide the resulting value by the number of observations.
Example
The following table shows the score obtained by five students in math exam. Find the arithmetic mean.
| Students | Marks |
|---|---|
| John | 75 |
| Mariah | 80 |
| Harry | 81 |
| Alice | 90 |
| Elizabeth | 60 |
Solution
To find the arithmetic mean, we will divide the total marks by the number of students:
Arithmetic mean = 

Hence, the arithmetic mean of the data is 77.2.
Median
It is the middle value of the data set. This value divides the dataset into two halves. The median of the data is computed after arranging the data either in ascending or descending order. The method of finding the median of the data set when the number of elements are even is different than the process of finding the median when number of elements is odd. In this section, we will see how to find the median of the dataset when it has even and odd number of elements.
Example 1
Find the median of the below data set.
41, 39, 25, 36, 55, 52, 40
Solution
The data set in this example consists of seven values. If the data contains an odd number of elements then the median is the middle number after arranging it in ascending or descending order.
First, we will arrange the above data set in ascending order like this:
25, 36, 39, 40, 41, 52, 55
The middle number is 40, hence it is the median.
Example 2
Consider the following data set.
12, 10, 5, 18, 19, 14
Find its median.
Solution
Since the data set in this example has even number of elements, therefore the median will be calculated by taking the average of middle two numbers after arranging the data set in ascending or descending order.
Let us arrange the data set in ascending order like this:
5, 10, 12, 14, 18, 19
Since the data has six elements, therefore the median will be the average of third and fourth numbers.
Median = 
Mode
The mode is the most repeated value in the data set. A data set can have one, two or multiple modes. A data set that has two modes is known as bimodal and the data set in which there are multiple modes is known as multi-modal data set. If all the elements in the data set are repeated with the same frequency, then the data has no mode.
Example 1
Find the mode of the data below:
4, 6, 4, 6, 8, 7, 9, 10, 6
Solution
In the above data, 4 is repeated two times and 6 is repeated three times. The most repeated value is 6 which is the mode of the data.

Example 2
Find the mode of the following data set:
1, 1, 2, 2, 3, 4, 5, 6, 4, 1, 2
Solution
In the above data, 1 and 2 both are repeated three times. Hence, there are two modes in the above data set which are 1 and 2.

Measures of Position
Measures of position are various techniques that are used to divide the data into equal groups. These values tell us the position of the value in the data set relative to other values. The data must be arranged in ascending order to compute the measures of position.
Quartiles
Quartiles divide the data set into four equal parts. Different quartiles reflect the three values that divide the data into four equal parts. We denote the first quartile as  and it represents 25% of the values less than it and 75% of the values greater than it. The second quartile is also known as median as it reflects 50% of the values above it and 50% below it. It is denoted as
  . The third quartile has 25% values greater than it and 75% values smaller than it. It is represented as
  .
.
The formulas for finding three quartiles of the data set are given below:
First quartile = 
Second quartile = 
Third quartile = 
Here, N = Total number of elements in the set.
Example 1
Find the three quartiles of the following data set.
1, 3, 5, 7, 9, 11, 13
Solution
The data set in this example is already arranged in ascending order.
First quartile =
= 
=  value
value
The number at the second position in the data set is 3, hence it is the first quartile.
Second quartile =
=  value
value
The number at the fourth position in the data set is 7, hence it is the second quartile.
Third quartile =
=
=  value
value
The number at the sixth position in the data set is 11, hence it is the third quartile.
Note: If we get the value of any quartile, let say 7.5, then we take average of 7th and 8th term to find the quartile.
Deciles
A decile splits the data set into ten equal segments. It is terminology in statistics that divides the data into ten intervals. It actually splits the data into ten equal segments on the number line.
We use the following formula for calculating the decile.
Here, i = 1, 2, 3, 4, 5, 6, ....10.
Example
Calculate the second and fifth decile of the following data set.
| SR No. | Values |
|---|---|
| 1 | 3 |
| 2 | 6 |
| 3 | 10 |
| 4 | 13 |
| 5 | 15 |
| 6 | 22 |
| 7 | 25 |
| 8 | 28 |
| 9 | 30 |
| 10 | 32 |
| 11 | 35 |
| 12 | 40 |
| 13 | 43 |
| 14 | 45 |
| 15 | 48 |
| 16 | 52 |
| 17 | 55 |
| 18 | 56 |
| 19 | 60 |
Solution
The formula for finding the decile is:
Substitute N= 19 and i = 2 in the above formula to get the second decile.
 value
value
Hence, the first decile is the value at the fourth position of the data set. The fourth value in the data set is 13, hence it is the second decile.
To find the 5th decile, substitute N = 19 and i = 5 in the formula:


 value
value
Hence, the 5th decile is the 10th value of the data set. The tenth value in the above data set is 32, hence it is the 5th decile of the data set.
Percentiles
The percentiles divide the data into 100 equal segments. Equal segments mean that each part has the same number of values in it.
The formula for finding the percentile is given below:
Example
Find the 25th and 75th percentiles of the following data set.
| Sr No. | Value |
|---|---|
| 1 | 5 |
| 2 | 10 |
| 3 | 12 |
| 4 | 15 |
| 5 | 18 |
| 6 | 20 |
| 7 | 25 |
| 8 | 28 |
| 9 | 32 |
| 10 | 35 |
| 11 | 38 |
| 12 | 43 |
Solution
To find the 25th percentile, substitute the values in the formula below:


The rank value 3.75 is more closer to 4 than 3, hence, the 25th percentile is the value at the fourth position of the dataset. The value at 4th position in the above table is 15.
To find the 75th percentile, substitute the values in the formula below:

9.25 is closer to 9 then 10, hence it is value at the 9th position. The value at the ninth position in the above table is 32, hence it reflects the 75th percentile of the data set.
Measures of Dispersion
In statistics, the measures of dispersion tell us how the distribution is stretched or squeezed. We can say that the measures of dispersion help us to determine how far the values of the distribution are from the center of the data. In this section, we will discuss four measures of dispersion, that are range, average deviation, standard deviation and variance.
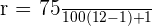
Range
To find range of the data, you need to take the difference of the highest and lowest value of the data set. The formula for finding the range of a data set is given below:
Range = Highest value - Lowest value
Example
The following table shows the marks obtained by five students in a math test. Find the range of the data set.
| 1 | 24 |
|---|---|
| 2 | 32 |
| 3 | 22 |
| 4 | 45 |
| 5 | 33 |
Solution
Range = Highest value - Lowest value
Range = 45 - 22 = 23
Average Deviation
To find the average deviation, you should know how to compute absolute deviation. Absolute deviation is computed by taking the mean of the data set and subtracting this mean from each value. After we have the absolute deviation values, we take the average of all the values to calculate average deviation.
Example
The salaries of five individuals is given in the table below. Find the average deviation of the data.
| Name | Salary |
|---|---|
| Alice | $2200 |
| John | $2500 |
| Harry | $1800 |
| Elizabeth | $2800 |
| David | $3800 |
Solution
First, we will calculate the mean of the data set:


Now, we will find the absolute mean of each value like this:
Alice = 2200 - 2620 = -420
John = 2500 - 2620 = 120
Harry = 1800 - 2620 = 820
Elizabeth = 2800 - 2620 = 220
David = 3800 - 2620 = 1180
Now, we will take the average of all the absolute values above to get the value of average deviation.
Average deviation = 

Variance

 = mean value of all the observations
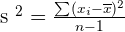
 = Value of one observation
 = mean value of all the observations
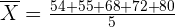
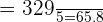
Example
| Names | Weight (kg) |
|---|---|
| John | 54 |
| Sarah | 55 |
| Mariah | 68 |
| Alice | 72 |
| Harry | 80 |
Solution


Standard Deviation
 = mean value of all the observations
 = Value of one observation = mean value of all the observations
Example
Did you like this article? Rate it!


Using facebook account,conduct a survey on the number of sport related activities your friends are involvedin.construct a probability distribution andbcompute the mean variance and standard deviation.indicate the number of your friends you surveyed
this page has a lot of advantage, those student who are going to be statitian
I’m a junior high school,500 students were randomly selected.240 liked ice cream,200 liked milk tea and 180 liked both ice cream and milktea
A box of Ping pong balls has many different colors in it. There is a 22% chance of getting a blue colored ball. What is the probability that exactly 6 balls are blue out of 15?
Where is the answer??
A box of Ping pong balls has many different colors in it. There is a 22% chance of getting a blue colored ball. What is the probability that exactly 6 balls are blue out of 15?
ere is a 60% chance that a final years student would throw a party before leaving school ,taken over 50 student from a total of 150 .calculate for the mean and the variance
There are 4 white balls and 30 blue balls in the basket. If you draw 7 balls from the basket without replacement, what is the probability that exactly 4 of the balls are white?