Chapters
In previous sections of this guide, we showed you how to calculate the mode, median, mean and variance. In addition, we provided you with some tips on how to interpret each measure and when one is more appropriate to use than another. Apply what you’ve learned here with these practice problems. Afterwards, be sure to check your answers and compare your responses with the solutions provided.


Mean, Median, and Mode
As a brief recap, the mean, median and mode are measures of central tendency. This simply means that they strive to capture the centre of the data. These three measures make up the three most common ways of describing data. Below, you’ll find their definitions as well as the best times to use each.
| Measure | Description | Formula | Uses |
| Mean | The average of the variable | \[ \bar{x} = \] \[ \frac{\Sigma x_{i}}{n} \] | When you want to find the average value When there are not any, or many, extreme values |
| Median | The midpoint of the variable | No standard formula | When you want to know the middle value When there are extreme values |
| Mode | The most occurring value of the variable | No standard formula | When you want to know the most frequent value |
Variance
The variance is part of a group of measurements that make up the other main group of calculations in statistics: measures of variability. Measures of variability try to capture how far spread or how close together the data are.
| Measure | Description | Formula | Uses |
| Variance | Measures the spread of the data | \[ s^2 = \frac{\Sigma (x_{i} - \bar{x})^2}{n-1} \] | When you want to understand the spread When you want to detect outliers |
| Grouped Variance | Measures the spread of grouped data | \[ s^2_{group} = { \frac{\Sigma f(x_{m} - \bar{x})^2}{n-1} } \] | When you want to understand the spread of grouped data |
Practice Problems
Problem 1
Data on temperatures are taken every day. You are interested in analysing the data for the month of august but notice there are some extreme values at the beginning and end of the month. Which measure of central tendency would be most appropriate to use given the following information?

| Day of the Month | Temperature (C) |
| 1-2 | 32 |
| 3-4 | 26 |
| 5-6 | 10 |
| 7-8 | 17 |
| 9-10 | 16.5 |
| 11-12 | 16.5 |
| 13-14 | 18 |
| 15-16 | 23 |
| 17-18 | 15.5 |
| 19-20 | 18.5 |
| 21-22 | 18 |
| 23-24 | 19 |
| 25-26 | 17.5 |
| 27-28 | 18.5 |
| 29-31 | 15.3 |
Problem 2
You’re interested in investigating the efficiency of a brand of batteries. You run a study, recording the number of hours each round of batteries last. Find the average number of hours this brand of batteries lasted from the following data set.
| Hours Lasted | Number of Batteries |
| 0 - 5 | 15 |
| 6 - 10 | 25 |
| 11 - 15 | 38 |
| 16 - 20 | 9 |
| 21 - 25 | 4 |
Problem 3
You’re interested in interpreting the distribution of ages across preferred modes of communication. Given the following information, give at least three statements on the data provided using measures of central tendency.
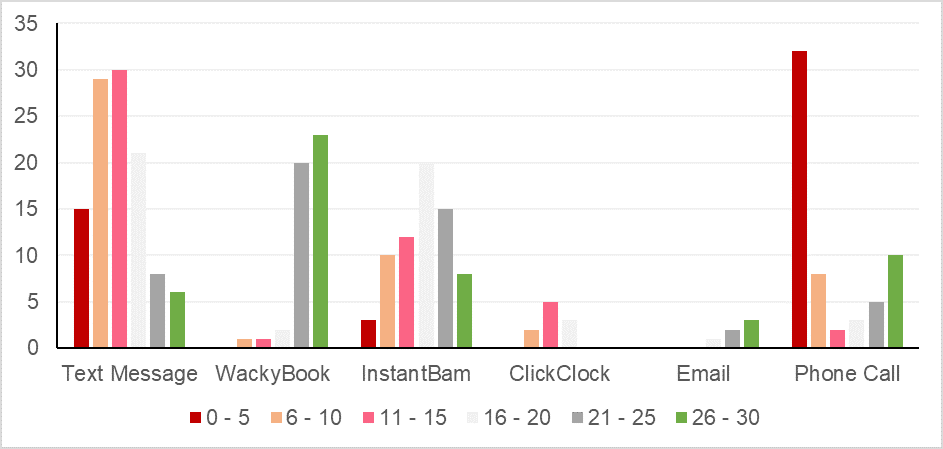
| Text Message | WackyBook | InstantBam | ClickClock | Phone Call | ||
| 0 - 5 | 15 | 0 | 3 | 0 | 0 | 32 |
| 6 - 10 | 29 | 1 | 10 | 2 | 0 | 8 |
| 11 - 15 | 30 | 1 | 12 | 5 | 0 | 2 |
| 16 - 20 | 21 | 2 | 20 | 3 | 1 | 3 |
| 21 - 25 | 8 | 20 | 15 | 0 | 2 | 5 |
| 26 - 30 | 6 | 23 | 8 | 0 | 3 | 10 |
Problem 4
You want to illustrate the example that changing units effect different measures differently. You have data on the average heights of males in the UK from 1900 to 1980. Find the average and variance of these heights, then calculate these measures for heights in feet and inches (1 in = 2.54cm). Choose an appropriate chart or plot to illustrate these changes.
| Year | Heights in Cm |
| 1900 | 169.4 |
| 1910 | 170.9 |
| 1920 | 171 |
| 1930 | 173.9 |
| 1940 | 174.9 |
| 1950 | 176 |
| 1960 | 176.9 |
| 1970 | 177.1 |
| 1980 | 176.8 |
Problem 5
You are analysing data on test grades for a high school biology class. You want to give an interpretation of the distribution of your variable. Using the information below, describe the distribution of test grades using the measures of central tendency and variability.
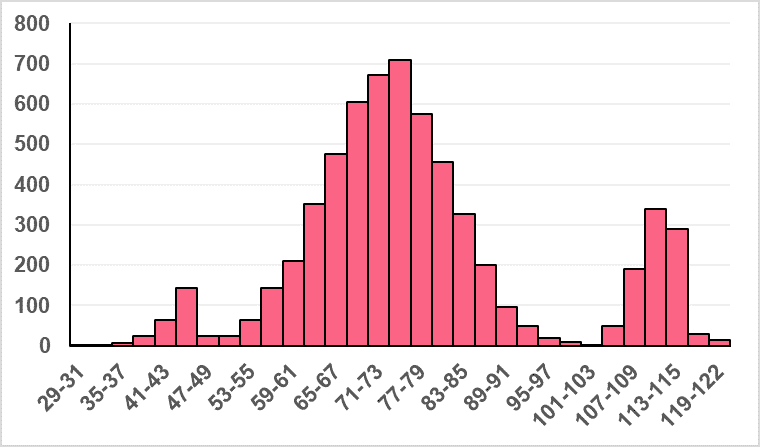
| Measure | Value |
| Group Variance | 296 |
| Group Mean | 77-79 |
| Group SD | 17 |
Solution to Practice Problems
Solution Problem 1
In this problem, you were asked to:
- Determine the most appropriate measure of central tendency for the data
Given the graph, we can see that most days of the month have the same average temperature except for the first week of August. Given that these are almost 10 degrees higher than the rest of the month, it would be most beneficial to use either the median or the mode.
Solution Problem 2
In this problem, you needed to:
- Find the average number of hours this brand of batteries lasted
Because the data is grouped, we need to find the group mean. We do this using the following formula.
\[
x_{group} = \frac{\Sigma(f_{i}*x_{m})}{n}
\]
| Hours Lasted | Number of Batteries
|  |  |
| 0 - 5 | 15 | \[ \dfrac{5-0}{2} = 2.5 \] | \[ 15*2.5 = 37.5 \] |
| 6 - 10 | 25 | \[ \dfrac{10-6}{2} = 8 \] | \[ 25*8 = 200 \] |
| 11 - 15 | 38 | \[ \dfrac{15-11}{2} = 13 \] | \[ 38*13 = 494 \] |
| 16 - 20 | 9 | \[ \dfrac{20-16}{2} = 18 \] | \[ 9*18 = 162 \] |
| 21 - 25 | 4 | \[ \dfrac{25-21}{2} = 23 \] | \[ 4*23 = 92 \] |
| Total | 91 | 64.5 | 985.5 |

Plugging this into the formula, we get,
\[
x_{group} = \dfrac{985.5}{91} = 10.8
\]
Meaning the group mean is between the interval 6 to 15. In other words, the batteries last, on average, between 6 and 15 hours.
Solution Problem 3
In this problem, you were asked to
- Make at least three statements on the data provided using measures of central tendency
Because we have grouped data, the easiest measure of central tendency to approximate by simply looking at the graph and table is mode. Take a look at the table below for sample answers for each age group.
| Age Group | Preferred Mode of Communication |
| 0 - 5 | Most children use the telephone as their primary mode of communication |
| 6 - 10 | Children between 6 and 10 use mostly text message to communicate |
| 11 - 15 | Teenagers between 11 and 15 use text message the most for communicating |
| 16 - 20 | Those aged 16 to 20 use text message the most and InstantBam almost as much |
| 21 - 25 | Those aged 21 to 25 use WackyBook as their primary mode of communication |
| 26 - 30 | Adults aged 26 to 30 mostly use WackyBook to communicate |
Solution Problem 4
In this problem you were asked to:
- Find the mean and variance for the data in cm and in
- Graph the data
The mean for the data is found by calculating the following,
\[
\bar{x} = \dfrac{169.4+170.9+171+173.9+174.9+176+176.9+177.1+176.8}{9}
\]
\[
\bar{x} = \dfrac{1566.9}{9} = 174.1
\]
To find the variance, we follow the formula,
\[
s^2 = \frac{\Sigma (x_{i} - \bar{x})^2}{n-1}
\]
\[
s^2 = \dfrac{70.4}{9-1} = 8.8
\]
To find the mean and variance in inches, we simply need to follow the rules for changing units.
\[
\bar{x}_{in} = \dfrac{174.1}{2.54} = 68.5
\]
\[
s^2_{in} = \dfrac{8.8}{(2.54^2)} = 1.4
\]

Solution Problem 5
In this problem, you were tasked with:
- Interpreting the chart using the information given
Find sample answers in the table below
| Measure | Value | Interpretation |
| Group Variance | 296 | The variable has a large variability, which is reflected in the fact that the data is spread unevenly about the mean. |
| Group Mean | 77-79 | The group mean here is slightly to the right of what we would expect it to be from looking at the graph. This is because there are some extreme values on the right. |
| Group SD | 17 | The standard deviation makes up quite a significant portion of the mean, which indicates that the spread is quite large. |
Did you like this article? Rate it!


Can you help me answer my activities