Chapters


Graph
Before we get into parametric form, it’s important that you get the basics down. Let’s take a look at a standard graph.
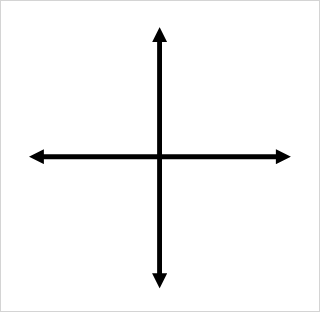
We use graphs to be able to visualize equations and understand patterns. Let’s take a look at the properties of a graph. The first property is that a graph has four quadrants.

| Quadrant | I | II | III | IV |
| Signs | (+,+) | (-,+) | (-,-) | (+,-) |
| Directions | (right, up) | (left, up) | (left, down) | (right, down) |
This makes it easy for us, because no matter what graph we’re looking at, we know the behaviour of any point on the graph as long as we know which quadrant it is in. The second property of a graph is that it has two axes: the x and y axis.

We know which direction to go in because each axis only goes in two directions.
| Direction 1 | Direction 2 | |
| x-axis | Right | Left |
| y-axis | Up | Down |
Coordinates
Coordinates make it easy for us to find any point on a graph. Because all graphs have the same properties, it is easy for us to locate any point on a graph given a few coordinates. Let’s look at the definition of coordinates as well as their standard form.
| Definition | Standard Form | Explanation | |
| Coordinate | Directions of a point on a cartesian plane | (x,y) | (Location on x-axis, Location on y-axis) |
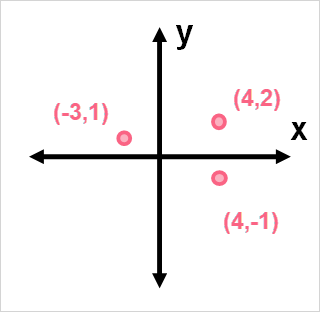
Any coordinates will give you insight into where a point is on a graph. Just by looking at the coordinates, we can tell the quadrant as well as draw them on a graph.
| Point | Quadrant | Explanation |
| (4,2) | I | (+,+) |
| (-3,1) | II | (-,+) |
| (4,-1) | IV | (+,-) |
Let’s draw these points on a graph.
Equation of a Line
When we talk about lines, we are usually talking about the lines that you can draw on a Cartesian plane. These lines are two dimensional, because any point, or coordinate, on the line can be found using two directions.
You only need two points two be able to make a line. Take a look at the example below.

| A | B |
| (1,2) | (4,8) |
However, you can also think of any line as many different points.
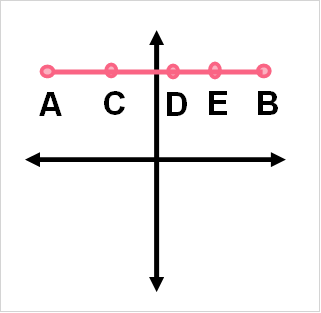
| A | C | D | E | B |
| (-5,1) | (-2,1) | (1,1) | (3,1) | (4,1) |
Because lines are straight, we can actually predict what the next point will be by continuing to draw that straight line.
Instead of drawing a line to see every point that is possible, we can use the equation of a line. You can think of the equation of a line as simply the equation that describes the pattern, or behaviour, of the line. In other words, having the equation of a line lets you know what any point on that line will be - even if you can’t see it.
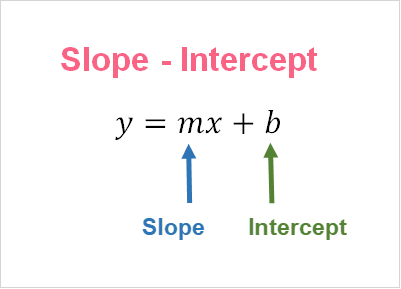
| x,y | m | b |
| Any point on the line | Slope | Y-intercept (where the line crosses the y axis) |
In this case, you can find the equation of the line by first finding the slope.

In our case, we can use any two points. Let’s use A and B.
 | 8 - 2 = 6 |
 | 4 - 1 = 3 |
| m |  |
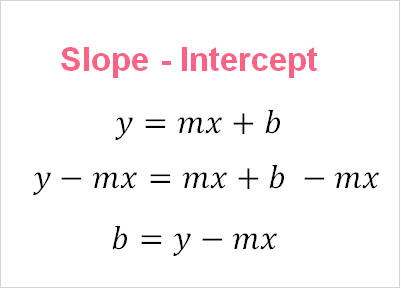
Now, we can rearrange the formula of the line to solve for b.
Simply plug in one of our points with the slope to find the y-intercept (b).
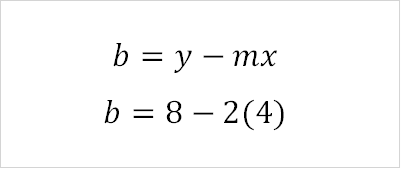
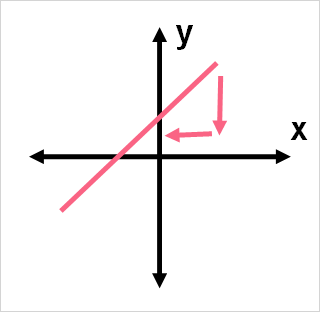
Now, we have the equation of our line.
| Slope | b | Equation |
| 2 | 0 | y = 2x |
Parameters
Sometimes, it can be more useful to display coordinates as parameters. Parameters in math are anything that we can replace with a numerical value. Let’s take an example.
We want to build a rectangular fence and we want to know the standard sizes of the fence that we can have according to the rules of the neighbourhood. We have two variables: the length and the width of the fence. These measurements of the fence are given by the parameter t, which is in meters.
| Variable | Size | |
| Length | x | Size of length x=t+2 |
| Width | y | Size of width y= |

Regardless of how we change these parameters, t, which is the number of meters, we will always get the size of the length and width.
Example
In order to get the sizes of the length and width of the fence, we can simply plug in the different combination of meters that the fence will be into the formula.
| t | x | y |
| 1 | 3 | 1 |
| 2 | 4 | 4 |
| 3 | 5 | 9 |
| 4 | 6 | 16 |
| 5 | 7 | 25 |
Shape of the Graph
Our parameter t decides how big or small the width and length will be. Because these points are functions of each other, we can also graph them. Let’s take a look at the graph they form.

Eliminating Parameter T
When we want to find the linear equation of this parametric form, all we need to do is follow the steps in the table below.
| Step 1 | The parametric form of x and y | x=t+2 y= |
| Step 2 | Solve for t for the x equation | x=t+2 t=x-2 |
| Step 3 | Replace the t into the y equation |  |
Now you have the equation for the line in parametric form. You can double check that you get the same answers by plugging in values into x to get the y value.
| x | y |
| (3-2)^{2} | = 1 |
| (4-2)^{2} | = 4 |
| (5-2)^{2} | = 9 |
| (6-2)^{2} | = 16 |
| (7-2)^{2} | = 25 |
Did you like this article? Rate it!


