Chapters


What is Regression?
The statistics involved in data analysis all have one thing in common: trying to find patterns within data. Patterns are essential, not only because they help us process everyday phenomena, but also because they can help us try to make predictions about the future.
One of the tools you can use to make predictions about the future is regression modelling. This section gives a brief overview of the concepts involved in regression, as well as practice problems you can use to test what you’ve learned.
Linear Correlation Coefficient
Most people have heard of the concept of correlation, but not many understand what it actually is. The most common correlation coefficient is the Pearson product-moment correlation coefficient, which is simply a statistic that tells us how closely related two variables are.
It is called a linear correlation coefficient because it measures the strength of the linear relationship between two variables. A perfect linear relationship describes a situation in which a change in one variable leads to the exact unit change in another variable. This perfect linear relationship corresponds to a correlation coefficient of 1.
Simple Linear Regression
The correlation coefficient is only one part of analysing the relationship between variables. Linear regression modelling is another tool you can employ to analyse variables. In fact, it is one of the most powerful and commonly used methods of analysis in statistics.
Simple linear regression is a linear regression model that has only one independent variable and one dependent variable. An independent variable is the variable that you want to use to study a dependent variable. You can think of the dependent variable as the one you’re interested in studying.
The most common form of regression is ordinary least squares (OLS), which is a type of regression model that strives to find the best fit for the data by reducing the distance between the regression line and the data points.
Multiple Linear Regression
Oftentimes, you’ll be interested in seeing how more than one independent variable affects a dependent variable. When your regression model includes one dependent variable and two or more independent variables it is called multiple linear regression.
You can think of multiple linear regression as the extension of simple linear regression and OLS. The concept is that each independent variable should be able to explain more variability, or changes, in the dependent variable.
Gauss-Markov Theorem
The Gauss-Markov theorem is a concept that you will encounter a lot when dealing with linear regression models. This theorem states that if a specific set of assumptions are met, than the OLS estimators will be unbiased and have the smallest variance out of all of the possible linear estimators.
The six classic assumptions of the Gauss-Markov theorem are:
- Regression model is linear in coefficients and the error term
- The error term has an expected value of zero
- Homoscedasticity: the conditional variance of the error term is constant for all observations
- The error terms are independently distributed and are not correlated with each other
- No independent variable is correlated with the error term
- No multicollinearity
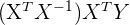
Matrix Multiple Linear Regression
In higher level statistics, you’re likely to encounter this equation, where capital letters are indicate a matrix.
While it may look very similar to the regular SLR model, there is one key difference: all variables and parameters are in matrix notation. Matrices are extremely important to understand if you want to delve deeper into statistics - specifically matrix properties and matrix multiplication.
Regression Problems
In this section, you will find a range of practice problems that you can use to solidify or test your knowledge in the basic to advanced concepts of regression. Try to solve the problems on your own based on other guides of this resources site and with the aid of the equations below. If you’re struggling to reach a solution, check out the step-by-step answers on each problem’s respective page.
Problem 3
You are interested in knowing the relationship between the weather and tourism levels. To investigate, you collect data from the touristic centre in a city during one month in the summer, counting the number of people that arrive at the square at the same time every day. Given the data set below, what is the correlation between temperature and tourism? Interpret the correlation and name a few other reasons why these two variables are or are not related.
| Temperature | Number of Visitors |
| 12 | 87 |
| 21 | 150 |
| 20 | 110 |
| 25 | 90 |
| 17 | 85 |
| 15 | 70 |
| 13 | 90 |
Problem 4
There are two variables that need to be studied: weight loss and days spent exercising one month. You are given a data set in which individuals have been asked the number of days they exercise for more than half an hour in one month. What kind of regression model can you use here? What are the results of this regression given the data set below. Interpret the model’s estimators.
| Exercise Days | Weight Loss (in kg) |
| 0 | 4 |
| 4 | 1 |
| 8 | 1.5 |
| 12 | 2 |
| 16 | 4 |
| 20 | 5 |
| 24 | 2 |
Problem 5
You’re curious about which factors play into the salary people earn. In order to find out you’d like to conduct a multiple linear regression analysis on data that has the salary, education level in years, and work experience for 10 individuals. Conduct a multiple regression analysis by finding the regression model on the following data set.
| Education | Experience | Salary |
| 11 | 10 | 30000 |
| 11 | 6 | 27000 |
| 12 | 10 | 20000 |
| 12 | 5 | 25000 |
| 13 | 5 | 29000 |
| 14 | 6 | 35000 |
| 14 | 5 | 38000 |
| 16 | 8 | 40000 |
| 16 | 7 | 45000 |
| 16 | 2 | 28000 |
| 18 | 6 | 30000 |
| 18 | 2 | 55000 |
| 22 | 5 | 65000 |
| 23 | 2 | 25000 |
| 24 | 1 | 75000 |
Problem 5.2
In the last problem, you were asked to build a multiple regression model based on the given data set. This data set dealt with information on 15 individuals and had each other their salary, education level in years and work experience in years.
Now that you have the multiple regression model, interpret what these results mean. Explain the meaning of each linear estimator, providing an example of one interpolation and extrapolation.
Next, see what would happen to the interpretation of your results if you transformed the variable of salary amount into logarithms. Give an example of what this might do to do interpretation of your regression model.
Problem 6
A classmate of yours is having trouble understanding what makes ordinary least squares, under the Gauss-Markov theorem, the best linear estimators as opposed to all the other estimators. Given the following example, explain what BLUE estimators mean and why they are important.
A sample is taken from a population that measures the money the observed companies spend on advertising and the amount of sales that they make in one month.
Problem 6.2
You are given the following dataset and multiple regression model that explores the relationship between car sales blood pressure, weight, height and age. You’d like to conduct a multiple regression analysis but first want to check through the 6 OLS assumptions. Through the use of graphs and statistics, do you think this model passes each assumption? Explain why or why not.
| Blood Pressure | Weight | Height | Age |
| 105 | 75 | 172 | 19 |
| 106 | 80 | 175 | 18 |
| 108 | 89 | 170 | 20 |
| 110 | 90 | 174 | 20 |
| 113 | 93 | 178 | 21 |
| 115 | 95 | 179 | 22 |
| 118 | 96 | 180 | 24 |
| 119 | 99 | 183 | 25 |
| 120 | 101 | 185 | 29 |
| 122 | 102 | 188 | 30 |
Problem 8
A shop owner is interested in understanding the demand of certain goods in her store based off of the price. In order to help the store owner, you’re tasked with conducting a simple regression analysis. Given the following data set, your first task is to explain how to format these observations into matrices along with the benefits of using matrices in statistics.
| Price | Demand |
| 120 | 110 |
| 125 | 100 |
| 130 | 90 |
| 135 | 45 |
| 140 | 20 |
Problem 9
In the previous problem, you were asked to format the data into matrices. Now, using these matrices, find the regression model equation and interpret the results in terms of what this means for the shop owner.
Equation Table
In this table, you will find all the equations you will need to use in order to solve the practice problems. If you’re having trouble understanding any of the formulas, make sure to review each page dealing with these formulas and the concepts behind them.
| Hypothesis Type | Description | Test Result |
 | States that a parameter is equal to, less or greater than, or different from a hypothesized value | is rejected when p-value < 0.05 |
 | States that a parameter is not equal to, less or greater, or different from a hypothesized value | is accepted when p-value < 0.05 |
| Center & Spread Formulas | Equations |
 | \[ \frac{Cov(x,y)}{\sigma_{x} \sigma_{y}} \] |
 | \[ \frac{\sum_{i=1}^{n}(x_{i}- \bar{x})(y_{i}- \bar{y})}{n-1} \] |
 | \[ \sqrt{\frac{\sum(x_{i} - \bar{x}^2)}{n-1}} \] |
 | \[ \sqrt{\frac{\sum(y_{i} - \bar{y}^2)}{n-1}} \] |
| Equations | Regression Formulas |
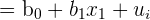 | Simple linear regression |
 | Multiple linear regression |
 | Residual |
 | MLR Matrix |
 | SSE Matrix |
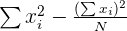
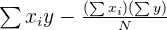
| Parameters and Variables | Equations |
 |  |
 |  |
 |  |
 |  |
 |  |
| Matrix Operations | Rules |
| Matrix Multiplication | Dimensions have to have the same inner value (n x k) x (k x p) Resulting matrix is (n x p) Row values are multiplied by column values |
| Inverse of 2 x 2 | Find the determinant  Switch a and b Switch d and c Make a and b negative |
| Inverse of 3 x 2 and above | Perform a set of elementary operations (subtraction, addition, multiplication and division) |
| Transpose | The matrix (n x k) becomes (k x n) Rows become columns |
Did you like this article? Rate it!


