In this article, we will discuss how to calculate the probability using tree diagrams. But before discussing the tree diagrams, let us first define probability.


What is Probability?
Probability explains the likelihood of the occurrence of an event
In other words, probability explains the chances of the occurrence of an event. There are many applications of probability in the field of agriculture, weather forecasting, commerce, and biological sciences. Some of the important properties of probability are given below:
- The probability of an event B is represented by the symbol P(B). The probability of event B is calculated using the following formula:

- The probability of a certain event is equal to 1.
- The probability of an impossible event is equal to 0.
- For two mutually exclusive events A and B, the probability is expressed as P(R U S) and it is equal to P(R) + P(S).
- The event having only one outcome is called an elementary event. The aggregate of probabilities of elementary events is 1.


Now, we will see what are probability tree diagrams and what are their attributes.
Probability Tree Diagrams
Calculating probabilities can be challenging. This is because, sometimes to calculate the probability, we have to add the outcomes and at other times we have to multiply them. Tree diagrams make this challenge easier for us as they give us the overall picture of the problem. Some attributes of tree diagrams are discussed below:
- We write the probability of each branch in a tree diagram on the branch
- We write the outcome at the end of the branch
- The end of each branch has a node that can start new branches on the basis of possible outcomes.
- Remember that the aggregate of probabilities of the branches of each node is equal to 1.
Example 1
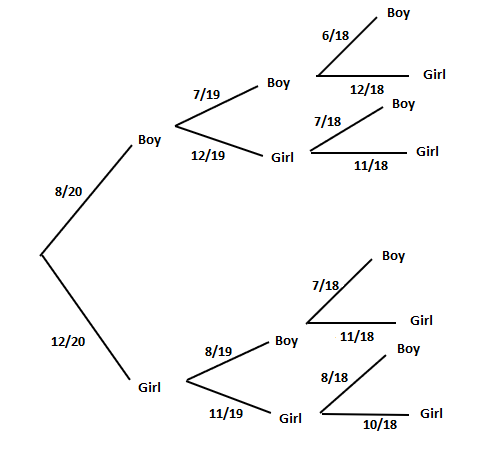
In a class, there are eight boys and 12 girls. If a teacher selects a group of 3 at random. Draw a tree diagram and find the probability that:
a) Three girls being selected
b) Two boys and a girl is selected
c) Two girls and 1 boy is selected
Solution
This question has 3 parts. We will solve each part one by one. First, we will make a tree diagram like this:
Part a
Number of girls in the class = 12
Total number of students in the class = 20
Probability of selecting one girl = 
Probability of selecting the second girl = 
Probability of selecting the third girl = 
Probability of selecting three girls at random = 
= 0.192
Hence, there is a 19.2% chance of selecting all three girls at random in a group.
Part b
There are three scenarios if the group contains 2 boys and a girl.
These scenarios are:
- (Boy, Boy, Girl)
- (Boy, Girl, Boy)
- (Girl, Boy, Boy)
We will calculate the probabilities of each of these scenarios separately like this:
Probability of selecting first boy = 
Probability of selecting the second boy = 
Probability of selecting the third girl = 
Probability of selecting 2 boys and a girl = 
= 0.098
Probability of selecting the first boy =
Probability of selecting the second girl = 
Probability of selecting the third boy = 
Probability of selecting a boy, a girl and then a boy = 
=0.098
Probability of selecting the first girl =
Probability of selecting the second boy = 
Probability of selecting the third boy =
Probability of selecting a boy, a girl and then a boy = 
=0.098
Probability of selecting 2 boys and a girl = 0.098 + 0.098 + 0.098
= 0.294
Hence, there is a 29.4% chance of selecting 2 boys and a girl from a class of 20 students.
Part c
There are three scenarios if the group contains 2 girls and a boy.
These scenarios are:
- (Boy, Girl, Girl)
- (Girl, Boy, Girl)
- (Girl, Girl, Boy)
We will calculate the probabilities of each of these scenarios separately like this:
Probability of selecting first boy =
Probability of selecting the second girl =
Probability of selecting the third girl = 
Probability of selecting 2 boys and a girl = 
= 0.15
Probability of selecting the first girl =
Probability of selecting the second boy =
Probability of selecting the third girl =
Probability of selecting a boy, a girl and then a boy = 
=0.15
Probability of selecting the first girl =
Probability of selecting the second girl =
Probability of selecting the third boy = 
Probability of selecting a boy, a girl and then a boy = 
=0.15
Probability of selecting 2 boys and a girl = 0.15 + 0.15 + 0.15
= 0.45
Hence, there is a 45% chance of selecting 2 girls and a boy from a class of 20 students.
Example 2
Three coins are rolled simultaneously. Draw a tree diagram and calculate the probability of three coins landing on
a) Three tails
b) Two tails and one head
Solution
The tree diagram of three coins rolled simultaneously is shown below:

Solution
Part a
The probability of the first coin to land on a tail = 
The probability of the second coin to land on a tail =
The probability of the third coin to land on a tail =
The probability of three coins to land on a tail = 
= 
Part b
There are three scenarios of this situation. These scenarios are:
- (Head, Tail, Tail)
- (Tail, Head, Tail)
- (Tail, Tail, Head)
From the tree diagram, we will see the probability of each of the above scenario separately like this:
Probability of first coin to land on a head =
Probability of second coin to land on a tail =
Probability of third coin to land on a tail =
Probability of three coins landing on a head, a tail and a tail respectively =
=
Probability of first coin to land on a tail =
Probability of second coin to land on a head =
Probability of third coin to land on a tail =
Probability of three coins landing on a tail, a head and a tail respectively =
=
Probability of first coin to land on a tail =
Probability of second coin to land on a tail =
Probability of third coin to land on a head =
Probability of three coins landing on a tail, a tail and a head respectively =
=
Probability of three coins to land on a head and two tails = 
= 
Did you like this article? Rate it!


Using facebook account,conduct a survey on the number of sport related activities your friends are involvedin.construct a probability distribution andbcompute the mean variance and standard deviation.indicate the number of your friends you surveyed
this page has a lot of advantage, those student who are going to be statitian
I’m a junior high school,500 students were randomly selected.240 liked ice cream,200 liked milk tea and 180 liked both ice cream and milktea
A box of Ping pong balls has many different colors in it. There is a 22% chance of getting a blue colored ball. What is the probability that exactly 6 balls are blue out of 15?
Where is the answer??
A box of Ping pong balls has many different colors in it. There is a 22% chance of getting a blue colored ball. What is the probability that exactly 6 balls are blue out of 15?
ere is a 60% chance that a final years student would throw a party before leaving school ,taken over 50 student from a total of 150 .calculate for the mean and the variance
There are 4 white balls and 30 blue balls in the basket. If you draw 7 balls from the basket without replacement, what is the probability that exactly 4 of the balls are white?