Chapters


Hypothesis Definition
Your favourite team is in the finals for this year's championships - what is the first thing that you, your friends, peers or family do? Make bets on who is going to win. Based on the many different statistics available to you - about team players’ abilities performance, number of wins and more - you can venture to make a hypothesis not just about your favourite sports team, but about many real life situations.
The definition of a hypothesis, at its most basic, is an educated guess. More formally, it is a proposed explanation based on previous facts which can be tested through hypothesis testing.
What is Hypothesis Testing?
Hypothesis testing in statistics enables you to test your hypothesis based on the probabilities given in your data. There are two types of hypotheses in hypothesis testing: the null and alternative hypothesis.
Take a look at the table below, which summarizes the definition of the two types of hypotheses and their notations.
| Type | Notation | Description |
| Null Hypothesis |  | Proposes that some parameter, like the mean or standard deviation, is equal, less than, greater than or different to a hypothesized value. |
| Alternative Hypothesis |  , ,  | Proposes that the same parameter is not equal, less than, greater than or different to a hypothesized value. |
Hypothesis tests are based on distributions of a random event. For example, say that you collect data on the batting averages of your favourite baseball team and that these means follow a normal distribution. Based on this normal distribution, we can compare how different some players' batting average is from the dataset by comparing it to the batting averages of all players.
This comparison is done by calculating the z-score for normally distributed data. The Z-score is a statistic that tells us how many standard deviations, or how different, a given point is from the mean of the data. The formula for Z-scores can be found below.
| Population z-score | Sample z-score |
 |  |
Used with a z-test, the z-score becomes the z-statistic. This is used when the population parameters  and and  are known. are known. | Used with a one-sample z-test, the z-score is also the z-statistic This is used when there is a hypothesized population mean and SD with an observed sample mean |
In hypothesis testing, the Z-score can be used as the test statistic, which is the value that we can use to determine whether or not we reject the null hypothesis. Tests that deal with normal distributions, therefore, are called Z-tests where the Z-score is simply called the Z-statistic.
Types of Hypothesis Testing
As mentioned above, hypothesis tests that make hypotheses on a normally distributed variable are called Z-tests. However, random variables can follow more than one different distribution.
Going further, the characteristics of the variable you want to test are important in determining what kind of hypothesis test you should use, including things like the type of variable it is (categorical, numerical), whether or not there is more than one variable, and more. The table below summarizes the most common hypothesis tests and when to use them.
| Test Type | Test Statistic | Variable Type | Number of Variables | Distribution | Test Parameters | Conditions |
| Z-test | z-statistic | numeric | 1 | Normal | Mean | Population SD known |
| T-test | t-statistic | numeric | 1 | Normal | Mean | Population SD unknown |
| ANOVA | F-statistic | numeric | 3 or more | Normal | Means | Need to compare means of groups |
| Chi-Square | Chi-square statistic | categorical | 2 | Association between two categorical variables |
As you can see from the table, there are many different basic tests you can use to analyse your data. The most common test you will encounter in statistics examples is a z-test. This is because they are very simple and can be used as easy examples of hypothesis testing.
The first three hypothesis tests deal with numeric variables. You may have noticed that the last one deals with categorical variables. Chi-square tests require ordinal or nominal variables that have independent groups. In this case, they should be mutually exclusive groups.
Meaning, if one observation is part of one group, it cannot be part of another group. Gender is a classic example, along with ethnicity, profession and more. Chi-square tests investigate whether or not there is an association between two categorical variables.
ANOVA is short for analysis of variance. ANOVA tests whether 3 or more means are equal. The most basic ANOVA test is called a one-way ANOVA, which strives to compare the means of 3 or more groups on one variable. One classic example is a one-way ANOVA testing the mean IQs in different groups. The null hypothesis would be that all means from the 3 or more groups are equal.
The assumptions, or conditions, for a one-way ANOVA are similar to those of a z and t test. It requires normally distributed, independent variables. One extra condition is that the variances within each test group need to be equal.
Hypothesis Test Example
Let’s go back to our batting average example. You have data on all of last season’s batting averages for every player and team. These batting averages follow a normal distribution and we assume that the population standard deviation is 0.02.
Let’s also assume that the observed sample mean batting average of 0.248 is the population mean, since it was derived from the population of all players. You are curious to know how likely a mean batting average above 0.296 would be for the league. Because the population standard deviation is known, we will conduct a z-test and choose a 95% confidence level, or  of 0.05.
This example will take you through conducting a one-tailed z-test step by step. The first step is to build our null and alternative hypotheses, which are written below.
| > 0.296 | This is our hypothesized mean, which is greater than 0.296 |
| < 0.296 | Our alternative hypothesis states that the hypothesized mean is less than 0.296 |
Below, you can see what this would look like on the normal distribution of batting averages.
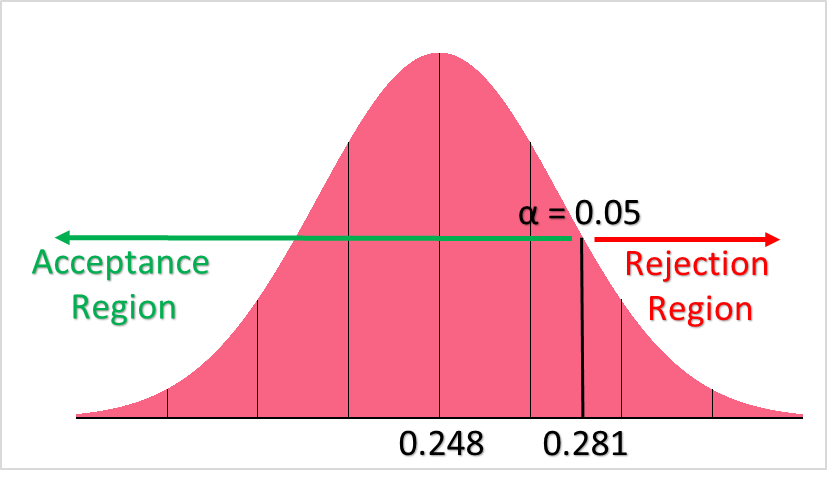
From this image, we can see both our population mean, our hypothesized mean, rejection and acceptance regions. Take a look at the table below for the interpretation of the latter.
| Region of Rejection | If our z-statistic lies anywhere to the left of the hypothesized mean, we reject the null hypothesis |
| Region of Acceptance | If our z-statistic lies anywhere to the right of the hypothesized mean, we do not reject the null hypothesis |
The second step for this z-test is calculating the z-statistic, whose formula is given below.
[
z = frac{x - mu}{sigma}
]
Please recall our parameters below.
 | 0.248 |
| 0.296 |
| 0.02 |
Plugging these values into the z-score formula, we get a z-statistic of:
[
z = frac{0.296-0.248}{0.02} = 2.4
]
The third step in performing a z-test is to look up your z-statistic in a z-table. Z-tables can be found anywhere online or in statistics textbooks. Keep in mind, however, that there are two types of z-tables: right-tail and left-tail tables.
Because we are looking for the probabilities of the area on the right of the distribution, we should look at a z-table with right-tail probabilities.
| Z | .00 | .01 |
| 2.3 | .0107 | .0104 |
| 2.4 | .0082 | .0080 |
From the z-table above, we can see that our p-value is 0.0082. Plotting the z-statistic and p-value on the distribution can give a better sense of what the results of the hypothesis test are.

The fourth and final step is the interpretation of the results. With a p-value < 0.05, which is our chosen confidence level, we reject the null hypothesis that the population mean is greater than the hypothesized mean of 0.296.
This is pretty interesting, as these means were the MLB batting averages for 2018 and 1930, respectively. Meaning, 1930 must have been a pretty special year as it was 2.4 standard deviations away from 2018’s mean.
Did you like this article? Rate it!


