Chapters


What is Hypothesis Testing
There is a particular trend on the internet that involves eating a popular laundry machine product which, if you haven’t guessed already, is dangerous. However, you’re interested in understanding how many people partake in this viral internet challenge.
One way you can do this is by making an educated guess on the number of creators that will perform the challenge based on the number of people that took part in a past internet trend. This is the basis of hypothesis testing. In its essence, a hypothesis is defined as a proposed explanation based on previous facts.
Hypothesis testing in statistics is a way for you to test probabilities in your data. For example, if you assume that all internet challenges follow the same distributions, you can start to make hypotheses such as the mean amount of people who participate and complete the challenge, whether or not some challenges are harder than others, and more.
For every test, there are two different types of hypotheses involved. The first is a null hypothesis, which is usually denoted as  . This hypothesis states that the result of whatever you want to test is purely from chance.
On the other hand, the alternative hypothesis, denoted as either  or
or  , states that the result of whatever you want to test is not from chance. In other words, it is non-random.
Types of Hypothesis Testing
In order to understand hypothesis testing, let's take a standard normal deviation as an example.
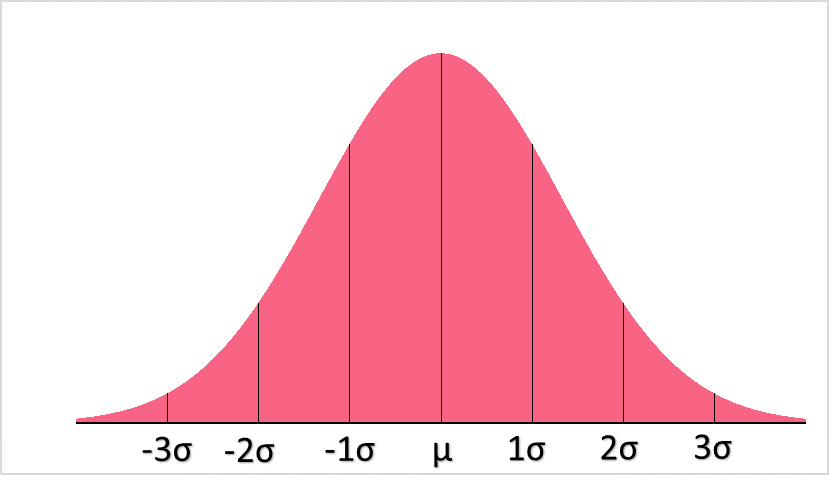
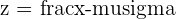
The first definition you’ll need to know for hypothesis testing is the Z-score. Because we are using a normal distribution, the type of hypothesis test we can conduct is a Z-test. A test statistic is used in hypothesis testing and is defined as the value which is used to decide whether or not to reject the null hypothesis.
The test statistic for Z-tests are called Z-statistics, or Z-scores. The formula for z-score is found in the table below:
| Population Z-score | Sample Z-score |
 |  |
 | z-score |
 | Population mean |
 | Population SD |
 | Hypothesised mean |
 | Sample mean |
As you can see, the population is the one for which the standard deviation is known. Because that isn’t often the case, the sample standard deviation, or s, can give us the sample Z-score.
There are two different ways you can test a value, which is by using either the p-value or the rejection region. The p-value is defined as the probability of observing the test statistic, in this case the Z-statistic, given the population or sample mean and standard deviation.
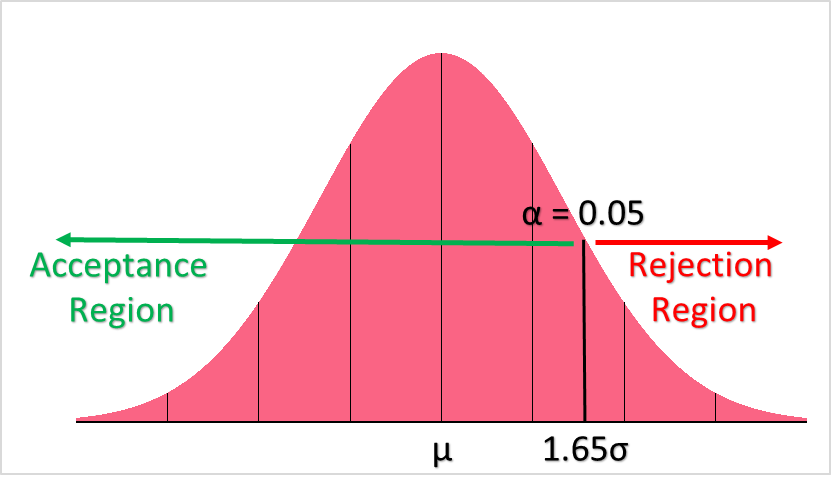
The rejection region, or conversely the region of acceptance, is a range of values that decides the rejection or “acceptance” of the null hypothesis. If the test statistic, here the Z-statistic, falls into the region of acceptance, is not rejected. If it falls into the region of rejection, is rejected.
Notice that null hypothesis can only be rejected or not rejected - this terminology is specifically used. Just because you cannot reject something, does not mean you can accept it.
One tailed tests are hypothesis tests in which the rejection region is only on one side of the distribution. This would be, for example:
: mean > 15
In this case, it is clear that the region of acceptance would be where sampling distribution is greater than 15 and the region of rejection would be where it is less than 15. As you can see in the picture above, there is only one “tail,” or direction of the region.
Two tailed hypothesis tests involve two “tails,” or two directions for the regions of acceptance. This is, for example:
: mean =15
As you can imagine, the region of rejection would be where the range of values are either above or below 15.
Other types of hypothesis tests, which are used for different distributions, are:
- t-tests
- ANOVA
- Chi-square tests
Below is a brief summary of when each test should be used:
| Type of Test | When to Use it |
| Z-test | When your variable has a normal distribution and the population parameters (mean, SD) are known |
| T-test | Used when population parameters are unknown (mean, SD) |
| ANOVA | When you want to compare two or more group means |
| Chi-square | When you want to determine a relationship between two categorical variables |
Type 1 and Type 2 Error Definition
Now that we’ve briefly gone over what hypothesis testing is and what types of hypothesis tests there are, let’s take a look at one important concept in statistics: type 1 and type 2 error. Take a look at the table below for the definitions of both.
| The reality of the situation | Accept from Statistical Test | Reject form Statistical Test |
| is true | Correct Conclusion | Type I Error: Rejecting when is true |
| is False | Type II Error: Accepting when is false | Correct Conclusion |
From the table, you can see four different scenarios, the results of which you get from creating and testing a null hypothesis:
- is true and statistical test accepts : correct
- is true and statistical test rejects : incorrect, type I error
- is false and statistical test accepts : incorrect, type II error
- is false and statistical test rejects : correct
Type I error is also known as a “false positive” because it rejects when it’s actually true, while Type II error is known as a “false negative.”
Type 1 Error Example
These types of errors happen because there are a very tiny amount of cases in real life where people can actually prove a null hypothesis to be true or false. Because of this, we can always calculate the chance that, even when accepting the null hypothesis, we could be wrong. Take the following table as an example.
| A child scored an IQ of 145 on a test and we’d like to see how likely a score like that is. The given mean and SD for the IQ of the population are 100 and 15 respectively. | = 100
|
| Because we know the population parameters, we will use a z-test | Z-score =  |
| Ho: the IQ of the child is 145 or greater |  > 145 > 145 |
| Ho: the IQ of the child is less than 145 | < 145 |
We start off by assuming that the null hypothesis is true so that we can see what the likelihood is of a child having an IQ of 145. We choose a 90% confidence level, or  = 0.1, for our hypothesis test. This significance level, the , is important in determining type I and type II errors because it tells you the risk of rejecting a null hypothesis that is true.
The image below shows the acceptance and rejection region for our hypothesis test.
Calculating our z-score, we get a z-statistic of:
[
frac{145-100}{15} = 3
]
Looking at our right-tail z-table below, we find the a probability of the child having a z-score of 3:
| Z | 0.00 | 0.01 |
| 3.0 | 0.0013 | 0.0013 |
| 3.1 | 0.0010 | 0.009 |
Our p-value is 0.0013. Because our p-value is less than our chosen alpha, which is at 0.1, we reject the null hypothesis because it is unlikely we would observe such an extreme test result given the population’s mean IQ and SD.
Let’s say, however, that the child really does have an IQ of 145 and we’re interested in calculating the risk of a type I error. Recall that a type I error is when we reject a true Ho based off of a statistical test.
The calculation of the type I error is very simple: it is the probability of the corresponding tail area. In this case, the probability of a type I error is 0.0013, or 0.13%.
Did you like this article? Rate it!


