Chapters


Population Definition
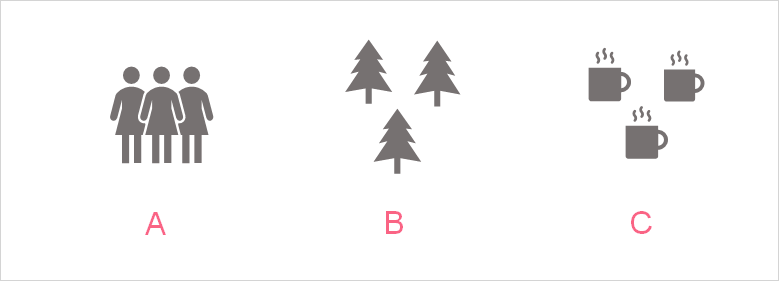
| Image | Study Interest | Population |
| A | Voter preference for people in the UK | All people of voting-age in the UK |
| B | Trees affected by an infectious disease | All trees in the UK |
| C | Daily number of tea drunk per person | All cups of tea drunk in the UK |
As you can see, populations tend to be enormous. Take the first example, described in image A. The number of people 18 and over was 52.7 million people in 2019, according to the ONS. Imagine measuring the voting preference of all those people!
Definition of a Sample
Because populations tend to be enormous, we need a way to estimate the metrics we want to study without needing to measure all units or individuals in the population. This is where samples come in. Samples are defined as a subset of a population that is used to estimate true population parameters. Take a look at the image below to see how we solve the examples given above.
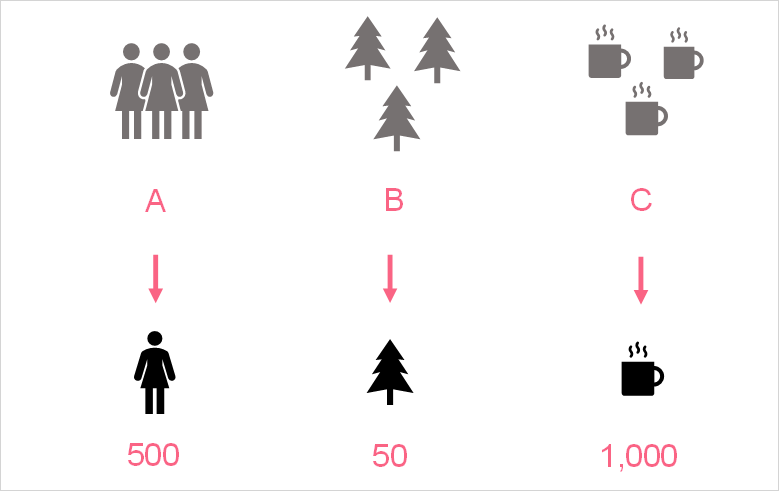
| Image | Population | Sample |
| A | All people of voting-age in the UK | 500 people of voting age in each region of the UK |
| B | All trees in the UK | 50 trees in each national park |
| C | All cups of tea drunk in the UK | Coffee drinks of 1,000 people in the UK |
Types of Samples
There are actually many different types of samples that you can take from a population. No one sample is the best, as each depends on the population of interest as well as the resources available to you. There are two main types of samples, which can be seen described in the image below.

While understanding the intricacies of samples aren’t super important here, it’s important to know that for probability samples, you are able to apply the inferential tools involved in probability theory. These inferential tools involve things like:
- Confidence interval
- Hypothesis testing
Confidence Interval Definition
As you can see, confidence intervals are part of the inferential tools of probability theory. As discussed, samples can be used to estimate the true population parameter. To understand this, let’s revisit the tea example.

| Composition | Mean Cups per Day | Meaning | |
| Population | All people in the UK who drink tea | 3 | True value, which rarely can ever be measured |
| Sample | A sample of 1,000 tea drinkers | 2.2 | Estimated by the population |
As you can see in the image above, we have a population parameter of 3 cups of tea per day per person versus what we measured in the sample: 2.2 cups. Because we’re estimating the true population number using the sample, we can use the confidence interval to capture the uncertainty in this estimation.
A confidence interval is defined as a range of values that’s likely to contain the true population parameter. It can be calculated for:
- Mean
- Proportion
Population Proportion
A population proportion is simply the true proportion measured for the population. A proportion is the ratio of a subset of a group in relation to the entire group. The table below illustrates the differences between a sample and population proportion.
| Formula | Example | |
| Population | $p = \frac{M}{N}$ | Number of people who voted pink in population |
| Sample | $\bar{p} = \frac{m}{n}$ | Number of people who voted pink in sample |
In practice, many people conduct studies on the same variable of interest. Continuing the example above, say five studies were conducted measuring the proportion of people who voted for pink.

The image above illustrates the distribution of these sample proportions. These proportions represent estimates of the true population proportion.
Confidence Interval for the Proportion
In order to be certain that we’ve captured the true population measure, we can build a confidence interval. The formula for the confidence interval is the following.
\[
Confidence \; Interval \; = \; \bar{p} \; \pm \; z*(\sqrt{\frac{\bar{p}(1-\bar{p})}{n}})
\]
The table below gives an explanation of each of the elements in the formula.
| Element | Description |
| $\bar{p}$ | The sample proportion |
| z | The z-score |
| n | The sample size |
This formula results in a range of values above and below the sample proportion that is likely to contain the population parameter. Take the example from before, where we were given a couple of different sample proportions.

As you can see, taking several samples gives us an idea of where the true population parameter might lie. Instead of taking many different samples, a confidence interval can give us an idea of the range of values that include the population proportion.
Confidence Level
The confidence level represents what amount of certainty you want for your confidence interval. The bigger the confidence level, the more certainty you introduce into your interval - and vice versa. Recall that z-scores are the values on a z-table corresponding to the z-scores on a standard normal distribution.
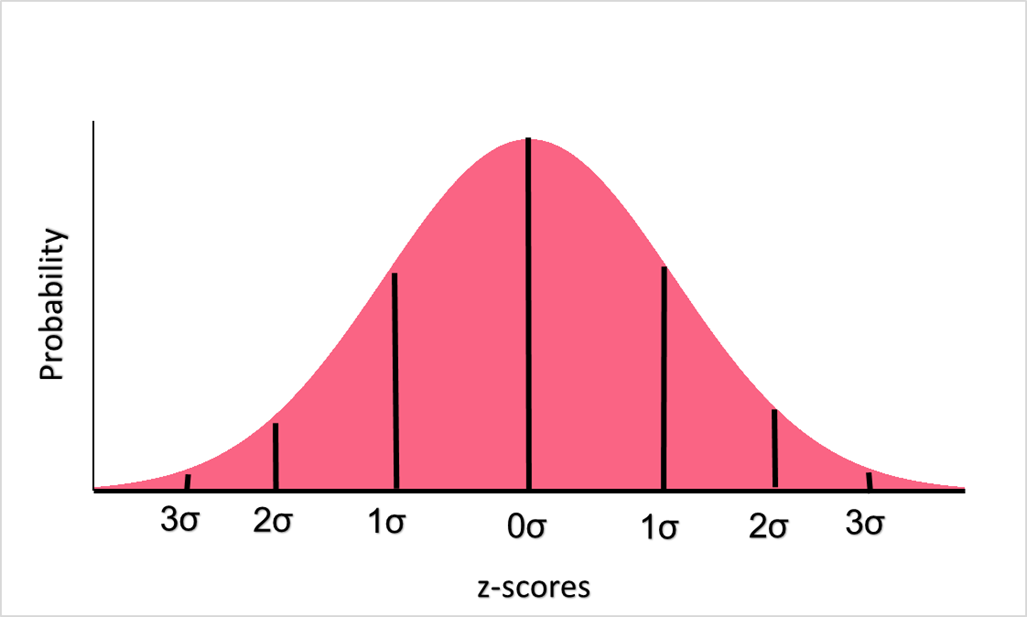
Each z-score is simply a standardized version of the normal value, which in this case would be our proportion. Each z-score corresponds to a probability, marked on the y-axis, which tells us how likely that z-score is given the distribution. The confidence level, which can be thought of as a probability, have their corresponding z-values. The most common ones are listed below.
| Confidence Level | Z-Score |
| 0.95 | 1.96 |
| 0.90 | 1.645 |
| 0.85 | 1.44 |
Interpretation of Confidence Interval
Let’s continue the example from before. Say that you take a sample of 1,000 people and 320 voted for pink. To find the confidence level, we first determine n and $\bar{p}$.
| Sample size | n | 1,000 |
| Sample proportion | $\bar{p}$ | 320/1000 = 0.32 |
Next, we simply plug in the values into the formula for the confidence interval. Let’s see the difference between confidence intervals at different confidence levels.
| 95% Confidence Interval | $0.32 \pm 1.96*(\sqrt{\frac{0.32*(1-0.32)}{1000}})$ | 0.35,0.29 | There is a 95% chance that the confidence interval between 350 and 290 contains the true population proportion of those who voted pink |
| 85% Confidence Interval | $0.32 \pm 1.44*(\sqrt{\frac{0.32*(1-0.32)}{1000}}) | 0.34, 0.3 | There is an 85% chance that the confidence interval between 340 and 300 contains the true population proportion of those who voted pink |
As you can see, the confidence interval is wider at a 0.85 confidence level than at 0.95.
Did you like this article? Rate it!


Using facebook account,conduct a survey on the number of sport related activities your friends are involvedin.construct a probability distribution andbcompute the mean variance and standard deviation.indicate the number of your friends you surveyed
this page has a lot of advantage, those student who are going to be statitian
I’m a junior high school,500 students were randomly selected.240 liked ice cream,200 liked milk tea and 180 liked both ice cream and milktea
A box of Ping pong balls has many different colors in it. There is a 22% chance of getting a blue colored ball. What is the probability that exactly 6 balls are blue out of 15?
Where is the answer??
A box of Ping pong balls has many different colors in it. There is a 22% chance of getting a blue colored ball. What is the probability that exactly 6 balls are blue out of 15?
ere is a 60% chance that a final years student would throw a party before leaving school ,taken over 50 student from a total of 150 .calculate for the mean and the variance
There are 4 white balls and 30 blue balls in the basket. If you draw 7 balls from the basket without replacement, what is the probability that exactly 4 of the balls are white?