Chapters


Exercise 1
A study is conducted in a neighborhood to better understand the types of recreational activities. 100 individuals are selected at random and surveyed.
It is known that 2,500 children, 7,000 adults and 500 elderly live in the neighborhood. Therefore, the researchers decide to choose the previous sample using stratified sampling as it is known that the recreations of the inhabitants change with age. Knowing this, determine the sample size for each stratum.
Exercise 2
Given the population of elements: {22, 24, 26}.
1.Write down all possible samples of size two, chosen by simple random sampling.
2.Calculate the variance of the population.
3.Calculate the variance of the sample averages.
Exercise 3
The height of students studying at a language school follows a normal distribution with a mean of 1.62 m and a standard deviation of 0.12. What is the probability that the mean of a random sample of 100 students will be taller than 1.60 m?
Exercise 4
A sample of the various prices for a particular product has been conducted in 16 stores which were selected at random in a neighborhood of a city. The following prices were noted:
95, 108, 97, 112, 99, 106, 105, 100, 99, 98, 104, 110, 107, 111, 103, 110.
Assuming that the prices of this product follow a normal law of variance of 25 and an unknown mean:
1.What is the distribution of the sample mean?
2.Determine the confidence interval at 95% for the population mean.
Exercise 5
The average heights of a random sample of 400 people from a city is 1.75 m. It is known that the heights of the population are random variables that follow a normal distribution with a variance of 0.16.
1.Determine the interval of 95% confidence for the average heights of the population.
2.With a confidence level of 90%, what would the minimum sample size need to be in order for the true mean of the heights to be less than 2 cm from the sample mean?
Exercise 6
The monthly sales of an appliance shop are distributed according to a normal law, with a standard deviation of \ 4,663 and \
 2500 + 7000 + 500 = 10000
 \frac{2500}{10000} = \frac{x}{100}
 \frac{7000}{10000} = \frac{y}{100}
 \frac{500}{10000} = \frac{z}{100}
 \mu = \frac{22 + 24 + 26}{3} = 24\sigma^2 = \frac{484 + 576 + 676}{3} -576 = \frac{1736}{3} -576 = \frac{8}{3}
 \overline{x}_{M}_{1} = 23
 \overline{x}_M_2 = 24
 \overline{x}_M_3 = 25\overline{x}_M = \frac{23 + 24 + 25}{3} = 24\sigma^2 _M = \frac{529 + 576 + 625}{3} - 24^2 = \frac{1730}{3} - 576 = \frac{2}{3}
 N(1, 62; \frac{0, 12}{\sqrt{100}})p(x \geq 1, 60) = p (z \geq \frac{1, 60 - 1, 62}{0, 012}) = p (z \geq -1, 66) = p (z \leq 1, 66) = 0, 9515
 = \frac{95 + 108 + 97 + 112 + 99 + 106 + 105 + 100+ 99 + 98 + 104 + 110 + 107 + 111 + 103 + 110}{16}\overline{x} = 104
 B(104, \frac{5}{\sqrt{16}})
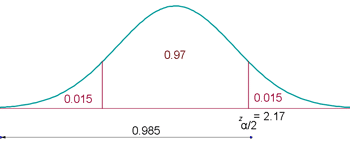
 N(104, 1.25)95%
 z_{\frac{a}{2}} = 1.96(104 - 1.96 \cdot 1.25, 104 + 1.9 \cdot 1.25) = (101.55; 106.45)
 n = 400\overline{x} = 1.75\sigma = 0.41 - \alpha = 0.95z _ {\frac{a}{2}} = 1.96(1.75 \pm 1.96 \cdot\frac{0.4}{20})(1.7108,1.7892)
 1.65 \cdot \frac{0.4}{\sqrt{n}} <0.02
 \frac{\sqrt{n}}{0.658} > \frac{1}{0.02}\sqrt{n} > 32.9
 n >1082.41
 900. A statistical study of sales in the last nine months has found a confidence interval for the mean of monthly sales with extremes of \
 5,839.
1. What were the average sales over the nine month period?

 ;
; 
2. What is the confidence level for this interval?


 %
%
Solution of exercise 7
The proportion of color blind individuals in a population needs to be estimated by the percentage observed in a random sample of individuals of size n.
1. If the percentage of color blind individuals in the sample is 30%, estimate the value of n so that, with a confidence level of 0.95, the error in the estimate is less than 3.1%.


At least 840 individuals.
2.If the sample size is 64 individuals, and the percentage of color blind individuals in the sample is 35%, determine using a significance level of 1%, the corresponding confidence interval for the proportion of the color blind population.


Solution of exercise 8
In a population, a random variable follows a normal distribution with an unknown mean and a standard deviation of 2.
1.In a sample of 400 selected at random, a sample mean of 50 was obtained. Determine the confidence interval with a confidence level of 97% for the average population.

2.With the same confidence level, what minimum sample size should it have so that the interval width has a maximum length of 1?


Solution of exercise 9
The quantity of hemoglobin in the blood spream of a man follows a normal distribution with a standard deviation of 2 g/dl.
Calculate the confidence level for a sample of 12 men which indicates that the population mean blood hemoglobin is between 13 and 15g/dl.


 %
%
Solution of exercise 10
In a department store chain, 150 people work in human resources, 450 in sales, 200 in accounting and 100 in customer service. In order to conduct a survey, a sample of 180 workers is selected.
How many employees should be selected from each department according to the criterion of proportionality?


 from human resources

 from sales

 from accounting

 from customer service
Did you like this article? Rate it!


Using facebook account,conduct a survey on the number of sport related activities your friends are involvedin.construct a probability distribution andbcompute the mean variance and standard deviation.indicate the number of your friends you surveyed
this page has a lot of advantage, those student who are going to be statitian
I’m a junior high school,500 students were randomly selected.240 liked ice cream,200 liked milk tea and 180 liked both ice cream and milktea
A box of Ping pong balls has many different colors in it. There is a 22% chance of getting a blue colored ball. What is the probability that exactly 6 balls are blue out of 15?
Where is the answer??
A box of Ping pong balls has many different colors in it. There is a 22% chance of getting a blue colored ball. What is the probability that exactly 6 balls are blue out of 15?
ere is a 60% chance that a final years student would throw a party before leaving school ,taken over 50 student from a total of 150 .calculate for the mean and the variance
There are 4 white balls and 30 blue balls in the basket. If you draw 7 balls from the basket without replacement, what is the probability that exactly 4 of the balls are white?