
The best Maths tutors available

5 (63 reviews)

1st lesson free!
5 (23 reviews)
1st lesson free!
5 (33 reviews)
1st lesson free!
5 (58 reviews)
1st lesson free!
5 (48 reviews)
1st lesson free!
5 (76 reviews)
1st lesson free!
5 (35 reviews)
1st lesson free!
4.9 (156 reviews)
1st lesson free!
5 (63 reviews)
1st lesson free!
5 (23 reviews)
1st lesson free!
5 (33 reviews)
1st lesson free!
5 (58 reviews)
1st lesson free!
5 (48 reviews)
1st lesson free!
5 (76 reviews)
1st lesson free!
5 (35 reviews)
1st lesson free!
4.9 (156 reviews)
1st lesson free!
Let's go
What is a Confidence Interval?
A confidence interval reflects the extent of the uncertainty of a specific statistic. These intervals are mostly accompanied by the margin of error. The confidence interval helps you to determine how confident you can be that the results from a survey reflect the opinion or trend of the entire population. Confidence intervals are associated with confidence levels.
Confidence Intervals Vs Confidence Levels
The two terms confidence intervals and confidence levels seem alike, however, there is a difference between these two terms. Confidence levels are represented as a percentage, for instance, the confidence level of this poll is 98%. It means that if you conduct the survey repeatedly, then 98% of the time the results of the poll will match the existing results.
Confidence intervals are represented in the form of numbers and they reflect the results of the survey. The confidence limits represent the two extreme values of the confidence interval that also reflect the range.
For instance, a survey is conducted in a locality to determine how much its residents spend on the grocery every month. After testing the statistics at a 95% confidence level, you get a confidence interval of (500,800). What does this interval reflect? Well, it means that the residents of that locality spend between \ 800 on groceries per month. You are 95% confident that the result of this survey is accurate.
Margin of Error
A margin of error reflects by how much percentage points your result will deviate from the real value of the population. For instance, a confidence interval of 98% with a 5% margin of error means that your value will be within 5 percentage points of the real value of the population 98% of the time. The formula for computing the margin of error is given below:
Margin of error =Critical value of the statistic x standard deviation
In the next section, we will discuss the steps to find the confidence interval.
Steps for Calculating the Confidence Interval
While solving the problems related to the confidence interval, you should follow the following steps:
Step 1
Calculate the mean and standard deviation of the population. In some cases, they will be given in the problem, however, if they are not mentioned, you can calculate these values yourself.
The formula for calculating mean is:

The formula for computing the standard deviation of a sample is:

Step 2
Determine the confidence interval you want for your sample and fetch the value of Z from the following table. In most cases, the confidence interval is 95% or 99% because these values indicate that the results are accurate.
| Confidence Interval | Value of Z |
| 80% | 1.282 |
| 85% | 1.440 |
| 90% | 1.645 |
| 95% | 1.960 |
| 99% | 2.576 |
| 99.5% | 2.807 |
Step 3
Substitute the values of Z, the mean and standard deviation in the following formula to calculate the confidence interval.
Confidence Interval = 
Here:
 is the mean of the sample
s reflects the standard deviation of the population
Z is the value chosen from the table
n reflects the number of observations
Let us now proceed to solve some of the examples related to the confidence interval.
Example 1
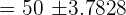
When 60 students in the class were weighed, the average weight came out to be 50 kg and the standard deviation was 15 kg. Assuming a Normal distribution, calculate 95% confidence limits for the mean weight (round off to the nearest whole number) of the whole class. Solution
In this example, we are given the following values: Number of students in the class = n = 60 Average weight = = 50 Standard deviation of the population = 15 First we need to find the Z value of 95% confidence level from the following table. | Confidence Interval | Value of Z |
| 80% | 1.282 |
| 85% | 1.440 |
| 90% | 1.645 |
| 95% | 1.960 |
| 99% | 2.576 |
| 99.5% | 2.807 |
The Z value at 95% confidence level is 1.960. Substitute these values in the following formula to get the confidence interval: Hence, the true mean weight of all the students in the class is likely to be in between 46 kg and 54 kg. Example 2
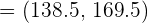
The heights of 25 athletes are measured. The average weight of an athlete is 154 cm. The standard deviation of the athlete's height is 30 cm. Assuming a Normal distribution, calculate 99% confidence limits for the mean height (round off to one decimal place) of all the athletes. Solution
In this example, we are given the following values: Number of athletes = n = 25 Average height = = 154 cm Standard deviation of the population = 30 First we need to find the Z value of 99% confidence level from the following table. | Confidence Interval | Value of Z |
| 80% | 1.282 |
| 85% | 1.440 |
| 90% | 1.645 |
| 95% | 1.960 |
| 99% | 2.576 |
| 99.5% | 2.807 |
The Z value at 99% confidence level is 2.576. Substitute these values in the following formula to get the confidence interval: Hence, the true mean height of all the athletes is likely to be in between 138.5 cm and 169.5 cm. Example 3
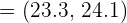
The average time taken by 12 runners to complete a round of 80 meters is 23.56 seconds. The standard deviation is 0.76 seconds. Assuming a Normal distribution, calculate 99.9% confidence limits for the mean time (round off to one decimal place) taken by all the runners to complete a round. Solution
In this example, we are given the following values: Number of runners = n = 12 Average time = = 23.56 seconds Standard deviation of the runners = 0.76 seconds First we need to find the Z value of 99% confidence level from the following table. | Confidence Interval | Value of Z |
| 80% | 1.282 |
| 85% | 1.440 |
| 90% | 1.645 |
| 95% | 1.960 |
| 99% | 2.576 |
| 99.5% | 2.807 |
The Z value at 99% confidence level is 2.576. Substitute these values in the following formula to get the confidence interval: Hence, the true mean time taken by all of the runners is likely to be in between 23.3 seconds and 24.1 seconds. Example 4
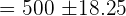
The average number of pages in 10 books on a shelf is 500. The standard deviation is 45 pages. Assuming a normal distribution, calculate 80% confidence intervals for the mean number of pages (round off to the nearest whole number) of all the books. Solution
In this example, we are given the following values: Average number of pages = = 500 pages Standard deviation = 45 pages First we need to find the Z value of 80% confidence level from the following table. | Confidence Interval | Value of Z |
| 80% | 1.282 |
| 85% | 1.440 |
| 90% | 1.645 |
| 95% | 1.960 |
| 99% | 2.576 |
| 99.5% | 2.807 |
The Z value at 80% confidence level is 1.282. Substitute these values in the following formula to get the confidence interval: Hence, the true average number of pages is likely to be in between 482 and 518. Example 5
The average marks obtained by 20 students in the class in a science exam is 78. The standard deviation is 8. Assuming a normal distribution, compute 95% confidence interval for average marks of the students (round off to one decimal place) of all the students. Solution
In this example, we are given the following values: Number of students = n = 20 Average marks obtained = = 78 pages First we need to find the Z value of 95% confidence level from the following table. | Confidence Interval | Value of Z |
| 80% | 1.282 |
| 85% | 1.440 |
| 90% | 1.645 |
| 95% | 1.960 |
| 99% | 2.576 |
| 99.5% | 2.807 |
The Z value at 95% confidence level is 1.960. Substitute these values in the following formula to get the confidence interval: Hence, the true average marks of students is likely to be in between 75.5 and 81.5.


Using facebook account,conduct a survey on the number of sport related activities your friends are involvedin.construct a probability distribution andbcompute the mean variance and standard deviation.indicate the number of your friends you surveyed
this page has a lot of advantage, those student who are going to be statitian
I’m a junior high school,500 students were randomly selected.240 liked ice cream,200 liked milk tea and 180 liked both ice cream and milktea
A box of Ping pong balls has many different colors in it. There is a 22% chance of getting a blue colored ball. What is the probability that exactly 6 balls are blue out of 15?
Where is the answer??
A box of Ping pong balls has many different colors in it. There is a 22% chance of getting a blue colored ball. What is the probability that exactly 6 balls are blue out of 15?
ere is a 60% chance that a final years student would throw a party before leaving school ,taken over 50 student from a total of 150 .calculate for the mean and the variance
There are 4 white balls and 30 blue balls in the basket. If you draw 7 balls from the basket without replacement, what is the probability that exactly 4 of the balls are white?