Chapters
- Practice Problems
- Problem 1: Central Tendency
- Problem 2: Interpreting Variability
- Problem 3: Finding the Group Mean
- Problem 4: Coefficient of Variation
- Problem 5: Quartiles
- Problem 6: Changing Units
- Solutions to Practice Problems
- Solution Problem 1
- Solution Problem 2
- Solution Problem 3
- Solution Problem 4
- Solution Problem 5
- Solution Problem 6
In our guide on descriptive statistics, we’ve shown you the fundamental concepts involved in the descriptive branch of statistics. From measures of central tendency to visualizing a standard normal distribution, we’ve taught you how to calculate measures and challenged you with practice problems.
In this section, you’ll find statistical word problems that require you to apply the knowledge you’ve learned with us thus far. Good luck!


Practice Problems
Problem 1: Central Tendency
You have gathered data on customers who come into your store for a week, including what they have bought and how many items they have bought. You’re interested in learning whether it’s worth it for you or not to start a loyalty program and, if so, on what products. Given the table below, use a measure of central tendency to solve your problem.
| Customer | Apples | Hummus | Bread | Oil |
| A | 3 | 15 | 1 | 0 |
| B | 5 | 6 | 2 | 1 |
| C | 1 | 9 | 2 | 0 |
Problem 2: Interpreting Variability
You’re studying the effects of a weed killer on a specific weed type. Given the following information, what can you say about the reliability of the weed killer on reducing the length of the weeds studied using measures of variability?
| Original Length (inches) | Length After 1 Month of Treatment (inches) |
| 1 | 0.5 |
| 2 | 1.9 |
| 1.5 | 0.2 |
| 2.3 | 1.7 |
Problem 3: Finding the Group Mean
Given the following information about 2017 estimated voter turnout, what can you say about young voters between 18 and 40 years of age? Data taken from YouGov UK.
| Age Group | People Sampled | Percentage Who Voted |
| 18-19 | 1077 | 57 |
| 20-24 | 2679 | 59 |
| 25-29 | 3648 | 64 |
| 30-39 | 7912 | 61 |
| 40-49 | 8237 | 66 |
| 50-59 | 10718 | 71 |
| 60-69 | 12388 | 77 |
| 70+ | 5956 | 84 |
Problem 4: Coefficient of Variation
You have the following information about estimated voter turnout. Which data set will be better to use in your research paper if you’re looking for the most accurate data?
| Data Set | 1 | 2 | 3 | 4 |
| \[ \bar{x} \] | 42 100 | 3 500 | 9 600 | 17 500 |
| \[ s \] | 1 000 | 150 | 210 | 3 000 |
| \[ n \] | 52 300 | 4 000 | 10 500 | 23 000 |
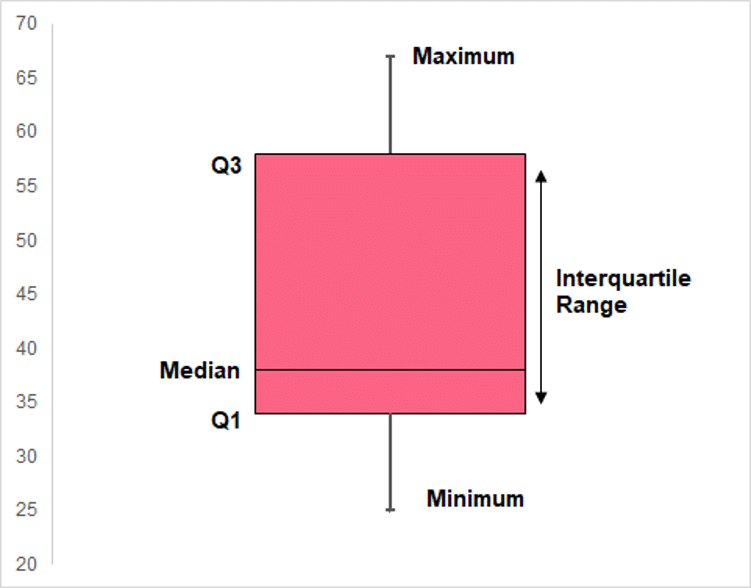
Problem 5: Quartiles
Interpret the characteristics of the following chart.
Problem 6: Changing Units
You are given the following information about hair growth caused by hair supplements in one month. Find the new mean and variance for each supplement after 1 month.
| Supplement | Mean Hair Length Before | Variance Before | Hair Growth After 1 Month |
| A | 30.6 | 0.3 | 103% |
| B | 38.2 | 0.1 | 105% |
| C | 32.4 | 0.5 | 101% |
| D | 34.5 | 0.2 | 104% |
Solutions to Practice Problems
In the previous section, you were asked to solve word problems covering the basics of descriptive statistics. Keep in mind that in statistics, there is rarely only one right answer.
Solution Problem 1
In this task, you were asked to:
- Find the best measure of central tendency for the question
- Use its calculation to respond whether or not it’s worth it to start a loyalty program
- If it is worth it, on which products
In this question, since we want to know the most frequent customers and what they buy the most of, we use the mode.
| Customer | Apples | Hummus | Bread | Oil | Total |
| A | 3 | 15 | 1 | 0 | 19 |
| B | 5 | 6 | 2 | 1 | 14 |
| C | 1 | 9 | 2 | 0 | 12 |
| Total | 9 | 30 | 5 | 1 |
Each customer buys over 10 products each week, which can indicate that a loyalty program will be beneficial. The product they should put on the loyalty program, or the mode of the products, is hummus.
Solution Problem 2
In this task we were asked to make a statement about the reliability of a weed killer. To do this, we follow the steps below.
| Original Length (inches) | Length After 1 Month of Treatment (inches) | Original Length - Length After Treatment |
| 1 | 0.5 | 0.5 |
| 2 | 1.9 | 0.1 |
| 1.5 | 0.2 | 1.3 |
| 2.3 | 1.7 | 0.6 |
| Variance | 0.25 | |
| Mean | 0.63 |
Looking at the variance and mean of the differences in length before and after treatment, we can see that the variance is almost half the mean. Meaning, the values are spread quite far around the mean, which indicates a lower reliability.
Solution Problem 3
Given the information in the table, we were asked to make a statement about young voters. To do this, we can find the group mean of people who voted aged between 18 and 40 by following the steps below.
| Age Group | People Sampled | Percentage Who Voted
|  |  |  |
 |  | *  | Average of upper and lower group limits | Frequency * midpoint | |
| 18-19 | 1077 | 57 | 614 | 18.5 | 11357 |
| 20-24 | 2679 | 59 | 1581 | 22 | 34773 |
| 25-29 | 3648 | 64 | 2335 | 27 | 63037 |
| 30-39 | 7912 | 61 | 4826 | 34.5 | 166508 |
| Total | 9356 | 275676 |
The group mean is found by,
\[
x_{group} = \frac{\Sigma(f_{i}*x_{m})}{n}
\]
\[
x_{group} = \frac{275676}{9356}
\]
\[
x_{group} = 29.5
\]
Which tells us that on average, the young people who actually voted were aged between 25 to 39.
Solution Problem 4
In this problem, you were asked to
- Find the most accurate data between the 4 data sets
Since we want to understand the variability between data sets, we use the coefficient of variation, found below.
| Data Set | 1 | 2 | 3 | 4 |
| CV | \[ \dfrac{1 000}{42 100} \] \[ *100\% \] \[ = 2.4\% \] | \[ \dfrac{150}{3 500} \] \[ *100\% \] \[ = 4.3\% \] | \[ \dfrac{210}{9 600} \] \[ *100\% \] \[ = 2.2\% \] | \[ \dfrac{3 000}{17 500} \] \[ *100\% \] \[ = 17.1\% \] |
For the third data set, the standard deviation is only 2.2% of the mean, meaning it has the least variability and will be more accurate.
Solution Problem 5
In this problem, you were tasked with interpreting the following chart.
We can interpret general characteristics about the distribution,
- Centre: The median is located between 35 and 40
- Spread: The data appears to be unevenly spread around the median
- Skew: The data are skewed to the right. Quartile 1 is closer to the median, while quartile 3 is farther, indicating that lesser values are located closer together than higher values.
Solution Problem 6
This problem involved:
- Calculating the new mean and variance for each supplement after one months of growth
In order to do this, we must use the rules for changing units.
| Supplement | Mean Hair Length Before | Variance Before | Hair Growth After 1 Month | New Mean | New Variance |
| A | 30.6 | 0.3 | 0.103 | \[ = 30.6 \] \[ *0.103 \] \[ = 31.5 \] | \[ = 0.3 \] \[ *(0.103^2) \] \[ = 0.32 \] |
| B | 38.2 | 0.1 | 0.105 | \[ = 38.2 \] \[ *0.105 \] \[ = 40.1 \] | \[ = 0.1 \] \[ *(0.105^2) \] \[ = 0.11 \] |
| C | 32.4 | 0.5 | 0.101 | \[ = 32.4 \] \[ *0.101 \] \[ = 32.7 \] | \[ = 0.5 \] \[ *(0.101^2) \] \[ = 0.51 \] |
| D | 34.5 | 0.2 | 0.104 | \[ = 34.5 \] \[ *0.104 \] \[ = 35.9 \] | \[ = 0.2 \] \[ *(0.104^2) \] \[ = 0.22 \] |
Did you like this article? Rate it!


Can you help me answer my activities