Chapters


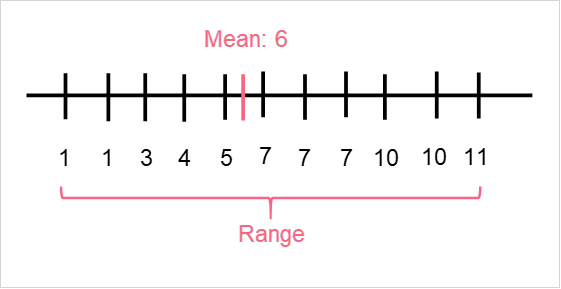
Measures of Central Tendency
| Central Tendency | Spread | |
| Definition | Captures the centre | The location of the observations around the centre |
| Metrics | Mean Median Mode | Standard Deviation Variation Range |
| Uses | Used mainly in descriptive statistics | Can be used for both descriptive and inferential statistics |
The table above illustrates some of the main differences between the two types of measures. However, keep in mind that they are usually reported together in order to have the context.
Mode Definition
The mode is defined as the value of the given variable that occurs the most. The number of times a value occurs is called the frequency of a variable. Let’s take a look at an example, where we’re interested in the number of visitors to a national park during the week.
| Day | People per Group |
| Monday | 1 |
| Tuesday | 3 |
| Wednesday | 5 |
| Thursday | 2 |
| Friday | 1 |
| Saturday | 3 |
| Saturday | 3 |
| Saturday | 4 |
| Sunday | 3 |
Here, we can look at two different modes, since we have two different variables. We can use it to answer questions like
- Which day do people usually visit the park?
- How big of a group usually visits the park?

How to Find the Mode
While the mode has a formula, the easiest way to find the mode is to simply calculate the frequency for the variable of interest and then see which value has the highest frequency. Most programs will do this for you automatically with some simple command or formula. Let’s take both variables above as examples.
| Day of the Week | Frequency |
| Monday | 1 |
| Tuesday | 1 |
| Wednesday | 1 |
| Thursday | 1 |
| Friday | 1 |
| Saturday | 3 |
| Sunday | 1 |
It is clear which day of the week most people visit the national park: Saturday. Next, you can calculate the frequency of the size of the groups that visit.
| Group Size | Frequency |
| 1 | 2 |
| 3 | 4 |
| 5 | 1 |
| 2 | 1 |
| 4 | 1 |
The most common size for groups is 3 people.
When to Use the Mode
The mode is quite a powerful tool when it comes to understanding the most frequent values in your data. The table below shows some examples of when the mode could be more useful for capturing the centre than other measures of central tendency.
| Situation | Example |
| The most frequent values | The most frequent users of a website |
| The distribution is very highly skewed | Taking the most frequent income in a highly skewed income distribution |
| For qualitative data | Can calculate frequencies for a categorical variable |
Problem 1
Let’s revisit the example from earlier, where we looked at the number of visitors at the national park during the week. That was a small data set, which made it easy to calculate the mode by hand. In the image below, you can see the number of visitors is significantly more.
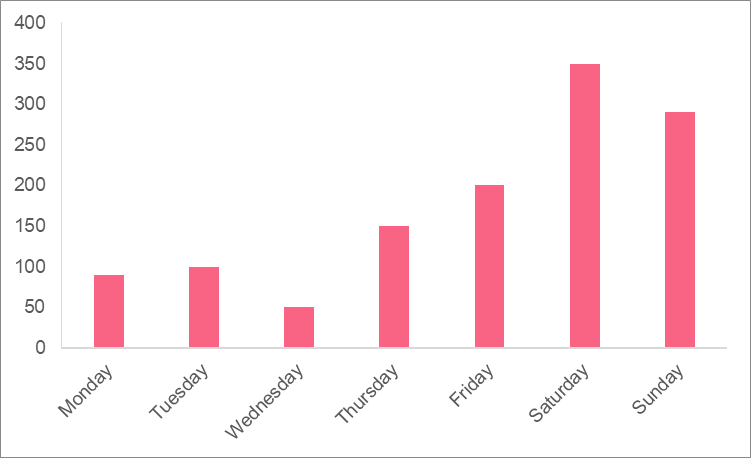
Identify the mode and state an advantage of the mode over other measures of central tendency.
Solution 1
In this question, we were asked to:
- Identify the mode
- State one advantage of the mode
From the image, we can see that the day with the most visitors is Saturday. One of the main advantages of the mode is that it can often be identified by a visual, just like the chart above. While the mean requires a formula to calculate it and the median requires a program to calculate it most of the time, the mode can be calculated more easily.
Problem 2
Take the following two datasets, which contain information on the income of 10 people. Determine which measure of central tendency would be best for each dataset. Make sure to justify your answer.
| Dataset A | Dataset B | |
| 1 | 3000 | 200 |
| 2 | 1000 | 100 |
| 3 | 4000 | 100 |
| 4 | 2500 | 250 |
| 5 | 8000 | 100 |
| 6 | 6500 | 150 |
| 7 | 5000 | 100 |
| 8 | 5500 | 300 |
| 9 | 7500 | 8000 |
| 10 | 7000 | 7500 |
Solution 2
In this question, we were asked to state which measure of central tendency would better capture the centre of the data. In order to answer this, we should first take a look at the distribution visually.
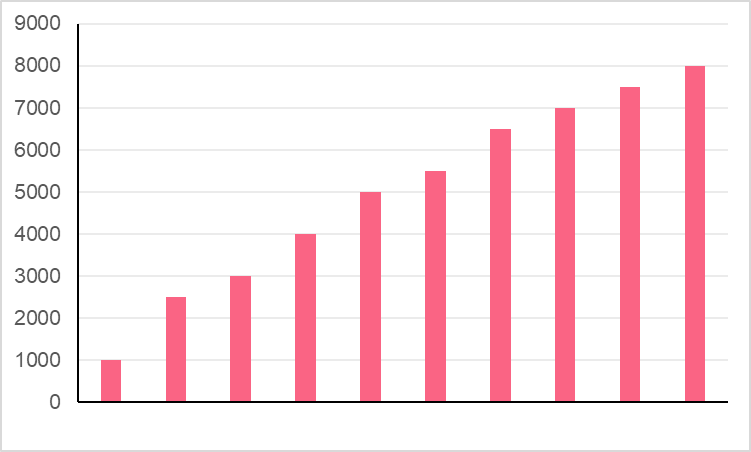

As we can see, these distributions are shaped completely different. While the first income distribution is somewhat of a gradual rise, the second income distribution has many of the same values with two extreme values on the higher end.
Using this information, we can ascertain that the mean or median is appropriate for dataset A, while the mode is best for dataset B.
| Dataset A | Dataset B | |
| Mean | 5000 | 1680 |
| Mode | N/A | 100 |
As you can see, the mode only functions if there actually is a most frequently occurring value. Since none of the incomes are the same in dataset A, we can’t use the mode. Looking at the mean for dataset B, we can see that it does not give an accurate picture of the centre.
This is because the dataset is highly skewed, which causes the extreme values to inflate the actual centre value. The mode, on the other hand, better reflects where the centre is located.
Did you like this article? Rate it!


Using facebook account,conduct a survey on the number of sport related activities your friends are involvedin.construct a probability distribution andbcompute the mean variance and standard deviation.indicate the number of your friends you surveyed
this page has a lot of advantage, those student who are going to be statitian
I’m a junior high school,500 students were randomly selected.240 liked ice cream,200 liked milk tea and 180 liked both ice cream and milktea
A box of Ping pong balls has many different colors in it. There is a 22% chance of getting a blue colored ball. What is the probability that exactly 6 balls are blue out of 15?
Where is the answer??
A box of Ping pong balls has many different colors in it. There is a 22% chance of getting a blue colored ball. What is the probability that exactly 6 balls are blue out of 15?
ere is a 60% chance that a final years student would throw a party before leaving school ,taken over 50 student from a total of 150 .calculate for the mean and the variance
There are 4 white balls and 30 blue balls in the basket. If you draw 7 balls from the basket without replacement, what is the probability that exactly 4 of the balls are white?