Chapters


What is Central Tendency
When you hear the news, chances are the statistics that are most often used when talking about anything from house prices to rainfall are measures of central tendency. Measures of central tendency are statistics that give us information about the centre of the data set.
| Measure | Definition | Example: House Price |
| Mean | The average of a variable | 15,060 |
| Median | The midpoint of a variable | 15,000 |
| Mode | The most frequently occurring value of a variable | 10,000 |

As you can see, these three measures try to calculate information on the middle point of the data.
| Measure | Value | Description |
| Mode | 10,000 | Gives the value that occurs the most, which can help us understand what the most common house price is |
| Median | 15,000 | Gives the middle point of all house prices, which tells us the house price that half of all houses are below and above |
| Mean | 15,060 | Gives us the average of all house prices, which tells us more or less what house price to expect |
Measures of Spread
Measures of spread, on the other hand, are measures that try to tell us how the values in our variable are distributed around the centre. While there are many types of spread measures, these are the three most common ones.
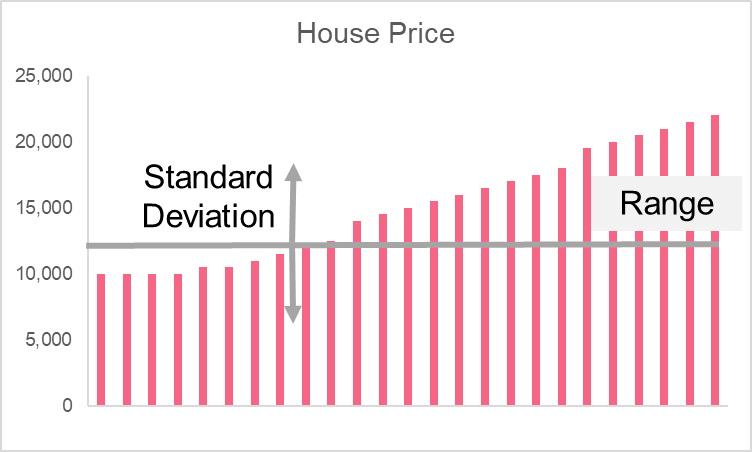
Looking at the same example, we can see there are some major differences in what we can analyse with measures of spread.
| Measure | Value | Description |
| Standard Deviation | 4,053 | Gives the average distance between all observations and the mean |
| Variance | 16,426,400 | Gives the average squared difference between all observations and the mean |
| Range | 12,000 | Gives the difference between the max in min values in the variable |
Definition of the Mean
The mean is typically defined as the average of a variable. This number gives us an idea of the average value per observation. Take the following data set as an example.
| No. | Salary |
| 1 | 4,000 |
| 2 | 3,000 |
| 3 | 4,500 |
| 4 | 2,800 |
The average for this group of salaries is 3,575. As you can see, this does not mean that each value is equal to 3,575 - it simply gives us an idea of the amount we can more or less expect for this group.

Types of Means
While we may be most familiar with the concept of a simple average, there are actually more types of means. The four most common means, along with their definitions and formulas, if any, are listed in the table below.
| Type | Definition | Formula |
| Arithmetic mean | The simple average of a group of numbers |  |
| Weighted mean | An average that gives different weights to different values |  |
| Geometric mean | Usually used to calculate the average of rates (like growth rates) |  |
| Harmonic mean | Usually used to calculate the average of ratios |  |
Arithmetic Mean Formula
While there are practical applications for the means mentioned in the previous sections, the most common mean that you will calculate is the arithmetic mean. Recall that the formula is like the one below.
\[
\frac{\sum x_{i}}{n}
\]
While this notation can seem a bit complicated, it is broken down and explained in the table below.
| Element | Description | Example |
 | The sum of all the elements that come after this symbol |  = = 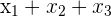 |
 | The ith element of this variable |  |
| n | The sample size | This table contains an x with an n of 3 |
Problem 1
You are interested in knowing how many cups of coffee people drink on average every day. To calculate this, you get a sample of 15 people and ask them how many cups of coffee they drink during the day. Explain which mean you would use here and calculate this mean using the data below.
| Person | # of Cups |
| 1 | 1 |
| 2 | 0 |
| 3 | 2 |
| 4 | 4 |
| 5 | 3 |
| 6 | 3 |
| 7 | 2 |
| 8 | 4 |
| 9 | 0 |
| 10 | 0 |
| 11 | 1 |
| 12 | 2 |
| 13 | 2 |
| 14 | 1 |
| 15 | 1 |
Solution 1
In order to calculate the mean, recall that the formula is the following.
\[
\frac{\sum x_{i}}{n}
\]
The first thing that we need to do is identify what each element is in this formula. This is done in the table below.
| # of cups | 26 |
| n | Sample size | 15 |
In other words, we simply add all the number of cups of coffee people drink per day and find the sample size, which is the number of people.
\[
\frac{1+0+2+4+3+3+2+4+0+0+1+2+2+1+1}{15} = \frac{26}{15} = 1.73
\]
This means that, on average, this group of people drinks 1.7 cups of coffee per day.
Problem 2
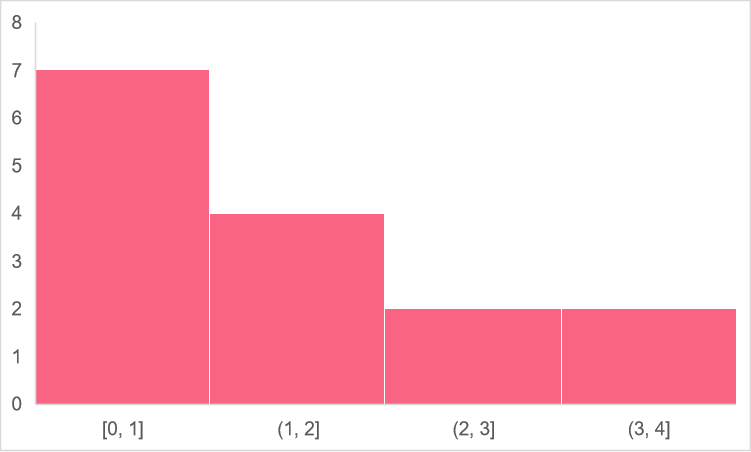
A company wants to find out how many different songs people listen to in a day on average, as this will help them understand how many distinct songs people listen to. They have a sample of 10 people and want to take the arithmetic mean in order to measure the information they need. Calculate the arithmetic mean and plot the mean on a graph.
| Person | # of Distinct Songs |
| 1 | 40 |
| 2 | 10 |
| 3 | 5 |
| 4 | 80 |
| 5 | 50 |
| 6 | 30 |
| 7 | 35 |
| 8 | 29 |
| 9 | 0 |
| 10 | 1 |
Solution 2
Like in the previous example, we first need to calculate each element of the formula. This is performed in the table below.
| # of songs | 280 |
| n | Sample size | 10 |
Now, we simply divide the sum of all the number of songs by the sample size.
\[
\frac{280}{10} = 28
\]
This means that on average, people listen to 28 songs per day. Now, let’s plot this onto a graph.
Did you like this article? Rate it!


Using facebook account,conduct a survey on the number of sport related activities your friends are involvedin.construct a probability distribution andbcompute the mean variance and standard deviation.indicate the number of your friends you surveyed
this page has a lot of advantage, those student who are going to be statitian
I’m a junior high school,500 students were randomly selected.240 liked ice cream,200 liked milk tea and 180 liked both ice cream and milktea
A box of Ping pong balls has many different colors in it. There is a 22% chance of getting a blue colored ball. What is the probability that exactly 6 balls are blue out of 15?
Where is the answer??
A box of Ping pong balls has many different colors in it. There is a 22% chance of getting a blue colored ball. What is the probability that exactly 6 balls are blue out of 15?
ere is a 60% chance that a final years student would throw a party before leaving school ,taken over 50 student from a total of 150 .calculate for the mean and the variance
There are 4 white balls and 30 blue balls in the basket. If you draw 7 balls from the basket without replacement, what is the probability that exactly 4 of the balls are white?