Chapters
standardization formula. In addition, we also taught you the basics of reading a z-table and what a z-table is. In this section, we’ll focus more on using z-tables and their interpretation, as well as offering a couple of practice problems to apply what you’ve learned.


What is a Z-score and Z-table?
Raw scores are unmodified data points which can include anything from test scores to heights. In statistics, these raw scores are standardized, or transformed into a z-score, in order to compare them to the rest of the data set. The standardization formula is the same as the z-score formula, which can explain why they’re also called standard scores.
\[
z_{i} = \frac{x_{i} - \bar{x}}{s}
\]
The z-score tells us how many standard deviations away from the mean a given number is. Z-scores can be plugged into a z-table in order to also find out what percentage of the distribution is below or above that z-score.
The distribution is the standard normal distribution because we are standardizing the data. Z-tables can be used to either give the percentage of a certain distribution above, below, or between a certain interval on a distribution. Below, you’ll find a step-by-step example of finding a z-score.
Z-Score Example
You have the following data on weight on a college campus. You want to be able to compare the data points to each other but don’t have standardized data. You do, however, have information on the mean and standard deviation.
| Measure | Value |
| Mean | 73 kg |
| SD | 12 |
We want to know how typical a weight of 95 kg is in our data set. Specifically, we want to know the percentage of people who weight above and below 95 kg. In order to do this, we must first find the standard score of 95.
\[
z_{i} = \dfrac{95-73}{11} = 1.83
\]
Recall that interpreting the z-score is easy because it expresses the number of standard deviations 95 kg is away from the mean. Recall that for standard normal distributions, the mean is 0 and the standard deviation is 1. The reason why the mean is 0 is because standardizing the mean results in a 0, as you can see below following our example.
\[
z_{i} = \dfrac{73-73}{11} = 0
\]
This, of course, makes sense because the mean, 73, is 0 standard deviations away from itself. In order to find the percentage of weights above and below 95 kg, we can use a left tail z-table. Keep in mind that there are both left and right tail z-tables. Let’s start by locating 95 kg on the standard normal distribution below.
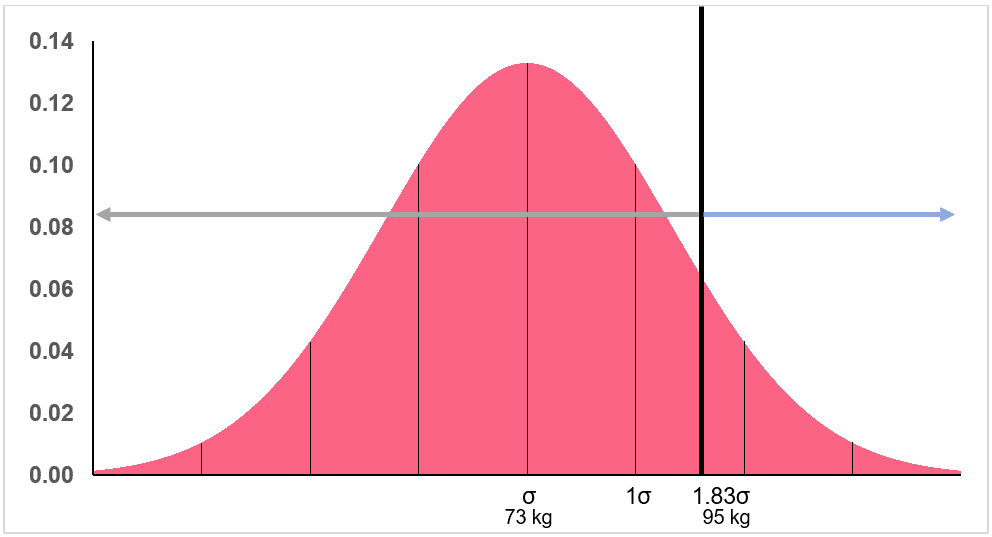

We get the number 0.96638, which means about 97% of the distribution weight below 95 kg given the mean and standard deviation. If we want to know what percentage scored above 97%, we don’t necessarily have to use a right tail z-table.
Because we know that the entire area under the curve of the standard distribution table is equal to 1, which is due to the fact that it represents a probability distribution, we know we can find the right tale percentage by taking 1 minus the left tale percentage.
Here, this would give us
\[
Right \thickspace tail \thickspace percentage = 1 - 0.96638 = 0.03362
\]
Which is about 3%. This means that about 3% of the distribution weighs above 95 kg. This makes sense because, added together, the percentage of what's on the left of 95 kg and what's on the right of it should add to 100%.
Practice Problems
In this section, we will put what you’ve learned to the test and ask you to solve various problems involving z-scores and z-tables.
Problem 1
You are interested in exploring the prices of mobile phones in the United States. The new model of a phone has come on the market recently, going at a price of about 1,200 US dollars. If the mean price for a phone in the country is  1,200?
| Z | 0 | 0.01 |
| 2 | 0.97725 | 0.97778 |
| 2.1 | 0.98214 | 0.98257 |
| 2.2 | 0.98610 | 0.98645 |
| 2.3 | 0.98928 | 0.98956 |
| 2.4 | 0.99180 | 0.99202 |
| 2.5 | 0.99379 | 0.99396 |
| 2.6 | 0.99534 | 0.99547 |
| 2.7 | 0.99653 | 0.99664 |
Problem 2
Your friend is stressed out over a grade he received for his last exam. You are trying to convince him that he actually did really well despite the grade he received. To make him feel better, you obtained the mean score and standard deviation of the exam from his teacher. Use the table and information below to figure out how many people scored above and below him.
- Your friends score: 49 out of 100 points
- Mean score: 15
- SD: 10.7
| Z | 0 | 0.01 | 0.02 | 0.03 | 0.04 | 0.05 | 0.06 | 0.07 | 0.08 |
| 3 | 0.99865 | 0.99869 | 0.99874 | 0.99878 | 0.99882 | 0.99886 | 0.99889 | 0.99893 | 0.99896 |
| 3.1 | 0.99903 | 0.99906 | 0.99910 | 0.99913 | 0.99916 | 0.99918 | 0.99921 | 0.99924 | 0.99926 |
| 3.2 | 0.99931 | 0.99934 | 0.99936 | 0.99938 | 0.99940 | 0.99942 | 0.99944 | 0.99946 | 0.99948 |
Problem 3
You are interested in renting an apartment in a couple of neighbourhoods. In order to narrow down your selection, you decide to take the mean price of all neighbourhoods and the standard deviation of those prices. Your budget is between 600 and 800 pounds per month. Given that the mean price is 1,200 pounds and the standard deviation is 250, what percentage of apartments are in your price range? Use the z-table below.
| Z | 0 | 0.01 |
| 1.6 | 0.94520 | 0.94630 |
| ... | ||
| 2.4 | 0.99180 | 0.99202 |
Solutions to Practice Problems
Below, you will find the solutions to the practice problems provided. Make sure to try working through these problems yourself before checking your answers.
Solution Problem 1
The z-score is found from the following,
\[
z_{i} = \dfrac{1200-528}{508} = 2.70
\]
Which means about 99.7% of phones are less expensive than the new model. This is illustrated in the image below.

Solution Problem 2
The z-score is found from the following,
\[
z_{i} = \dfrac{49-15}{10.7} = 3.18
\]
Which means he scored above 99.9% of the class and only 0.07% scored above him, as calculated below.
\[
P_{right} = 1 - 0.99926 = 0.00074
\]
Solution Problem 3
The z-scores are found from the following,
\[
z_{i} = \dfrac{800-1200}{250} = -1.6
\]
\[
z_{i} = \dfrac{600-1200}{250} = -2.4
\]
The negative z-score is simply,
\[
z_{negative} = 1-z_{positive}
\]
This can be illustrated from the image below.

Which means the percentages for each z-score are,
\[
1-(z_{1.6}) = 1-0.94520 = 0.0548
\]
\[
1-(z_{2.4}) = 1-0.99180 = 0.0082
\]
Since we only want the interval between these two percentages, we simply take the difference of the lower and upper bounds
\[
0.0548 - 0.0082 = 0.0466
\]
Which means only about 5% of apartments are available in your price range.
Did you like this article? Rate it!


Can you help me answer my activities