Chapters
In other sections of this guide on descriptive statistics, we taught you the basics of finding mean, median, standard deviation and percentiles. We provided you the formulas to each, as well as introduced some intermediate topics involving these measures of central tendency and variability. Here, we’ll present some advanced topics relating to these measures, namely the standard error and percentile rank.


Measures of Central Tendency and Variability
While measures like mean, median, standard deviation and percentiles can seem somewhat basic, the truth is that they are some of the most powerful tools of analysis within descriptive statistics and which form many of the fundamental concepts in more advanced, inferential statistics.
Percentiles, for example, is a concept that is used in quantile regression - which strives to identify patterns within different quantiles of a data set. These advanced applications rely on a strong, fundamental understanding of these more basic concepts. Below, you’ll find a brief recap of the formulas for sample mean, median and standard deviation as well as when they’re used and how to interpret them.
| Formula | Uses | Interpretation | |
| Mean | \[ \bar{x} = \frac{\Sigma x}{n} \] |
| The average of the data set, capturing where most values are cantered |
| Median | No standard formula, is found by identifying the middle value of ordered data |
| The midpoint of the data, representing the point where half the data falls above and below |
| SD | \[ \sqrt{ \frac{\Sigma (x_{i} - \bar{x})^2 }{n-1} } \] |
| Is used to determine how typical a value is for a data set with a given mean and standard deviation |
Standard Error
The concept of the standard deviation is a great starting point for understanding the standard error. It is defined as the estimate of the standard deviation of an estimate. Thus far, you’ve been calculating the standard deviation of an entire sample. Meaning, you’ve calculated a measure by which you can identify how likely any value would appear given the mean and sample size of your data set.
The standard deviation typically goes hand in hand with the distribution of a variable. Every distribution you will encounter reflects a probability density function, where each point on the horizontal axis corresponds with the probability of it occurring in a given data set on the vertical axis.
The question the standard deviation of a variable or data set attempts to answer is whether a given value is likely to be found for a given distribution. The question the standard error tries to answer is whether how likely a given statistic, such as the mean, is to be found for a given data set.
Instead of trying to find the distribution of a data set, the standard error tries to find the distribution of a given statistic. Recall the difference between a sample and a population. Measures of a population are called parameters, where the standard deviation of a parameter gives us information about the distribution of that parameter.
Measures of a sample, however, are estimates of parameters and are called statistics. The standard error, then, is an estimate of the standard deviation of a statistic.
If this is confusing, take the data sets below as an example. Each measure the test scores of students at different schools for the same test.
| Observation | School A | School B | School C |
| 1 | 45 | 29 | 66 |
| 2 | 64 | 54 | 57 |
| 3 | 38 | 59 | 58 |
| 4 | 70 | 67 | 52 |
| 5 | 62 | 68 | 32 |
| Mean | 56 | 55 | 53 |
Taking these three sample means, we can make an informed guess that the mean test score for the region is around 55 points. If we had information for ten more schools, then 100 more schools, and finally for all the schools in the region - we could start to get closer and closer to some middle value that may be higher or lower than 55 points.
Because we don’t always have the chance to take infinitely many samples, a probability distribution of means is a great way of estimating how likely a given mean is for a particular data set. In the table below, you’ll find the formulas for the standard deviation and the standard error of the mean for a population and sample, respectively.
| Population | Sample |
| \[ \sigma_{\bar{x}} = \frac{\sigma}{\sqrt{n}} \] | \[ SE = \frac{s}{\sqrt{n}} \] |
Problem 1
Given the following dataset, what can you say about the accuracy of the average of the data?
| Observation | Value |
| 1 | 45 |
| 2 | 67 |
| 3 | 28 |
| 4 | 32 |
| 5 | 29 |
| 6 | 46 |
| 7 | 61 |
| 8 | 58 |
| 9 | 49 |
| 10 | 36 |
| 11 | 34 |
Problem 2
Given the following information, determine which data set has a lower standard error of mean.
| Observation | School A | School B | School C |
| Mean | 56 | 55 | 53 |
| SD | 4 | 10 | 8 |
| Sample Size | 9 | 1 000 | 250 |
Problem 3
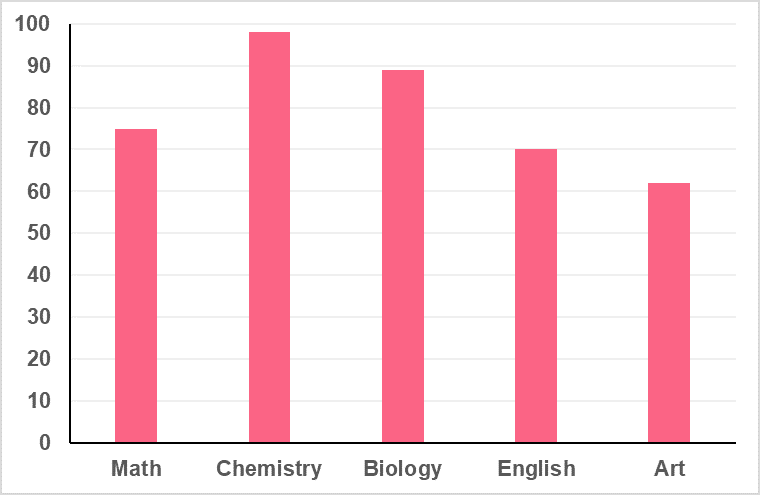
Given the following chart, determine one of the measures of central tendency.
Problem 4
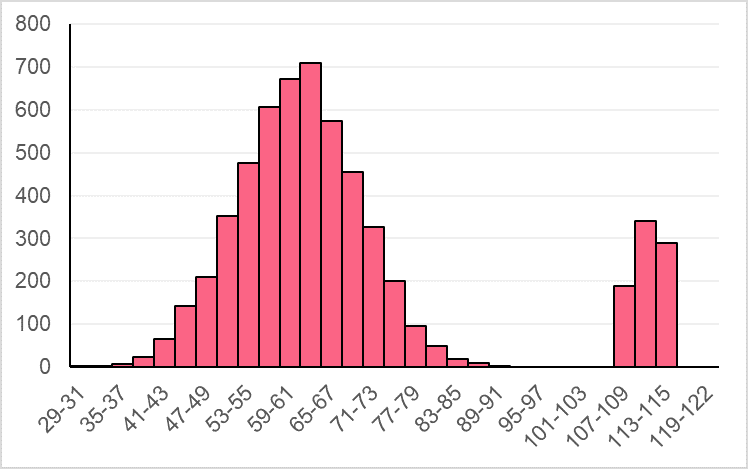
Given the following chart, choose which measure of central tendency would be most appropriate.
Solution Problem 1
In this problem, you were asked to:
- Say something about the accuracy of the mean
In this case, we first find the mean by following the steps below.
| Observation | Value |
| 1 | 45 |
| 2 | 67 |
| 3 | 28 |
| 4 | 32 |
| 5 | 29 |
| 6 | 46 |
| 7 | 61 |
| 8 | 58 |
| 9 | 49 |
| 10 | 36 |
| 11 | 34 |
| Total | 485 |
The mean is calculated as
\[
\bar{x} = \dfrac{485}{11} = 44.1
\]
To find the accuracy of the mean, we need to calculate the standard error of the mean by first finding the standard deviation.
\[
s = \sqrt{
\dfrac{1832.91}{(11-1)} = 13.5
}
\]
Then, we plug the SD into the formula for standard error.
\[
SE = \frac{s}{\sqrt{n}} = \dfrac{13.5}{\sqrt{11}} = 4.1
\]
Because the standard error is relatively small when compared to the dataset, this suggests the mean is pretty accurate.
Solution Problem 2
You were asked to determine which data set has a lower standard error of mean. Using the information given, you can calculate the standard error for each sample.
| Observation | School A | School B | School C |
| SE | \[ = \dfrac{4}{\sqrt{9}} \] \[ = 1.33 \] | \[ =\dfrac{10}{\sqrt{1000}} \] \[ = 0.32 \] | \[ = \dfrac{8}{\sqrt{250}} \] \[ = 0.51 \] |
Based on the calculations performed in the table above, the sample with the lowest standard error of the mean is School B.
Solution Problem 3
The only measure of central tendency we can get from this chart is the mode, which is Chemistry.
Solution Problem 4
Because there are extreme values between 107 and 119, either the mode or the median would be most appropriate depending on what we’d like to investigate.
Did you like this article? Rate it!


Can you help me answer my activities