Chapters


Measures of Central Tendency and Variability Part 2
In previous sections, you learned about the basics of descriptive statistics: measures of central tendency and of variability. These include measures like the mode, mean, median, standard deviation and variance. You also learned how to calculate each measure from a data set.
Here, you will learn about each measure in greater detail. In addition, you’ll be asked to apply your knowledge and decide which measure best represents the data.
Measures of Central Tendency and Variability
The reason many students have a love-hate relationship with maths is because, in the majority of cases, there are only correct solutions and wrong solutions. While the calculation of statistics is pretty uniform, the application of statistics can be very diverse. When asked to analyse a data set, there is rarely one correct answer, but rather a collection of answers that can be true depending on what question you’re asking.
This can make the task of interpreting a data set seem very daunting, as you have a range of different measures you can choose to calculate from the data. It’s important to understand that it’s not always appropriate to use one single measure for every data set, which can make your job of understanding data difficult. However, there are a couple of rules you can follow to help you choose whether or not to use one statistic over another.
When to Use Mean, Median and Mode
When deciding which measure of central tendency to use, it can be helpful to remember why exactly we use these measures in the first place. The goal of these measures is to try to capture the centre of the data, or the values that are most common in the data set. In other words, we’re less interested about extreme or unlikely values and more focused on finding what a “typical” observation looks like.
For example, in a data set about the price of meals in restaurants located in different cities, we can be interested in finding out the typical price of a meal in each city. Because our question involves finding where the centre of our data lie, we’re interested in finding the typical values in price. While there’s bound to be extremely cheap and expensive restaurants, chances are they don’t make up the majority of restaurants in a city.
While you may be thinking that taking the average can be a good representation of the centre of the data, there are many scenarios in which taking a simple average won’t actually reflect the centre of the data.
Example 1: Mean versus Median
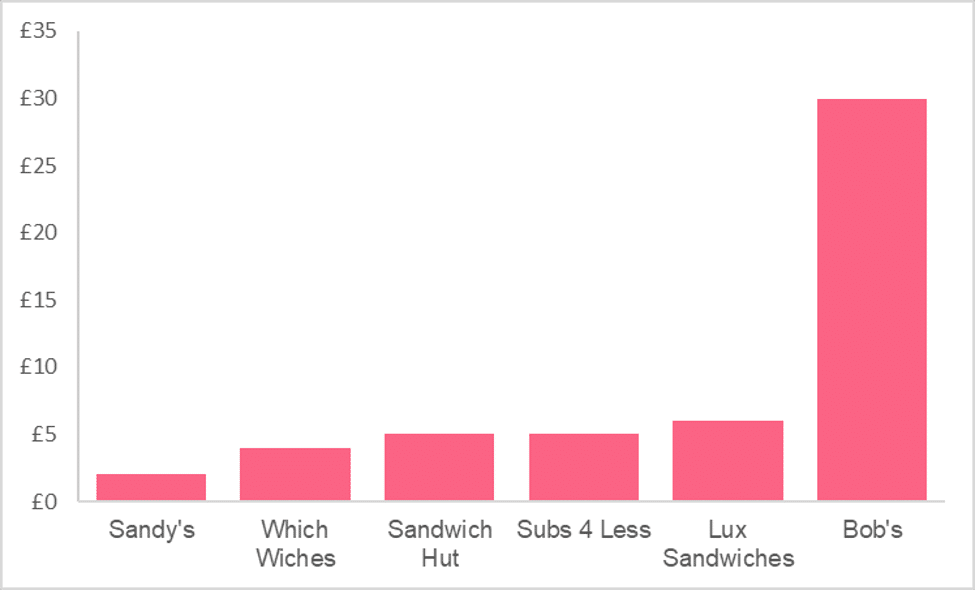
Using our previous example in restaurants in different cities, let’s assume that each restaurant serves only one dish: sandwiches. We want to calculate a central price for sandwiches in City A. Below, we have the prices for one sandwich in each restaurant in pounds.
| Observation | Restaurant | City | Price |
| 1 | Sandy’s | City A | 5 |
| 2 | Which Wiches | City A | 6 |
| 3 | Sandwich Hut | City A | 4 |
| 4 | Subs 4 Less | City A | 2 |
| 5 | Lux Sandwiches | City A | 30 |
| 6 | Bob’s | City A | 5 |
Using the table above, let’s go ahead and find the average, rounding to the nearest hundredth.
\[
Mean = \dfrac{52}{6} = 8.67
\]
From this figure, we may assume that 8.67 is a good representation of what a typical sandwich costs. However, looking at the data, we can see that there seems to be one extreme value in our data, also known as an outlier. This becomes clear when looking at a graph of each sandwich price below.
If we take out this potential outlier, the average is now calculated as:
\[
Mean = \dfrac{22}{6} = 3.67
\]
This makes a pretty big difference in what we think of as the central price for sandwiches in this city. This is because the mean takes into account every value in our data set, which can make it harder to capture the true centre when there are extreme high or low values in our data set.
Let’s take a different approach by, instead, calculating the median. First, we order our data from least to greatest.
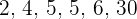
The median value is the average of two fives, which is simply five. This is still almost 4 pounds lower than the mean with Lux Sandwiches included, which tells us that it may be better at capturing the centre of our data set. Even if Lux Sandwiches were to raise their sandwich price to 100 pounds, the median would remain the same while the mean would be about 20 pounds!
While the mode here would be the same as the median, making it a good candidate for the best measure of central tendency, mode is typically more useful in other scenarios. If, instead, we were a restaurant owner interested in opening a new location, we would want to find the city where the most people buy sandwiches. In other words, in this case the mode would be more useful to us than the average or the median.
Here are a couple of rules of thumb you can use when deciding which measure to use.
- If there are outliers or extreme values, the median may be the best measure of central tendency
- If there aren’t any extreme values or outliers, the mean may be the best, especially with large sample sizes
- If the goal is to find the highest frequency, or amount, of a certain variable, the mode will probably be the best measure
Did you like this article? Rate it!


Can you help me answer my activities