Chapters


Percentiles, Quartiles and Deciles
If you’ve ever taken a standardized test, you will have used the word “percentile” before. It’s association with what many students consider the bane of their existence - official exams - isn’t doing the concept any favours. However, percentiles might be more important than many people realize - involved in everything from the apps on your phone to the algorithms that choose which songs you’re most likely to enjoy.
In this section, you’ll learn everything you need to know about what percentiles are, how to calculate them, and why they’re important in statistics.
What are Percentiles?
The simple definition for a percentile is that it indicates the number at which a certain percentage of data falls below. As you learned in previous sections, there are two types of measurements in descriptive statistics: measures of central tendency and variability.
Percentiles are one version of measuring the variability within a data set. A percentile is an important measure because it can help you understand a certain data set better than simple means, modes or medians can.
The easiest way to understand why is to look at an example. You have a group of test scores out of 100 points from a class, following the table below.
| Observation Number | Score |
| 1 | 15 |
| 2 | 22 |
| 3 | 24 |
| 4 | 27 |
| 5 | 32 |
| 6 | 36 |
| 7 | 40 |
| 8 | 41 |
| 9 | 50 |
| 10 | 90 |
You scored 50 points. At first glance, 50 out of 100 points may seem like a disappointing grade - for many classes, it would also be considered at the point of failure. However, calculating the percentile, you are at the 90th percentile. In other words, 90% of students scored lower than you did.
To calculate the percentile, your data should be ordered from least to greatest, similar to taking the median. Next, take the number for which you’d like to calculate the percentile for, in our case 50, and count what position its in.
In this case, there are 8 students who scored below 50, which means our score is in the 9th position. Next, you take the 9 and divide it by n, or our sample size. In this case,  =10. So together, we have 90%. This tells us that, although 50 out of 100 points can seem like a low score, you actually did better than 90% of the people in your class.
Example 1: Finding the Percentile Value
You can be in a situation where you want to find the value corresponding to a certain percentile. Taking our example above, you want to find the 70th percentile, or the score at which 70% of students scored below.
To do this, we take

\[
0.70*10 = 9
\]
The index gives you the observation number for which your 70th percentile is located. If it has a decimal, round to the nearest whole number. Here, the index 7 means that the 7th observation in our data set is the score at the 70th percentile. Counting from the lowest to the highest score, we reach the 7th observed value: a score of 40, which is the 70th percentile for our data.
If we wanted to find the median, we can also use percentiles. For odd numbers, the median is:
\[
\dfrac{n}{2} = index
\]
In this case, since we have an even amount of numbers, we take the average of two indices,
\[
index \thickspace 1 = \dfrac{n}{2}
\]
\[
index \thickspace 2 = \dfrac{n}{2} + 1
\]
Here, we get
\[
\dfrac{10}{2} = 5
\]
and
\[
\dfrac{10}{2} + 1 = 6
\]
Meaning the, the median is the average of the scores found at the fifth and sixth values in our ordered data set,
\[
\dfrac{34+36}{2} = 34 \thickspace points
\]
This means that 50% of students scored below 34 points and the other 50% of students scored above 34 points.
What are Deciles?
Deciles are a form of percentiles that split the data up into groups of 10%. Meaning, every decile contains 10% of the data. To find the decile, first order the data from least to greatest. Then, divide the data by 10. This indicates the number of observed values within each decile.
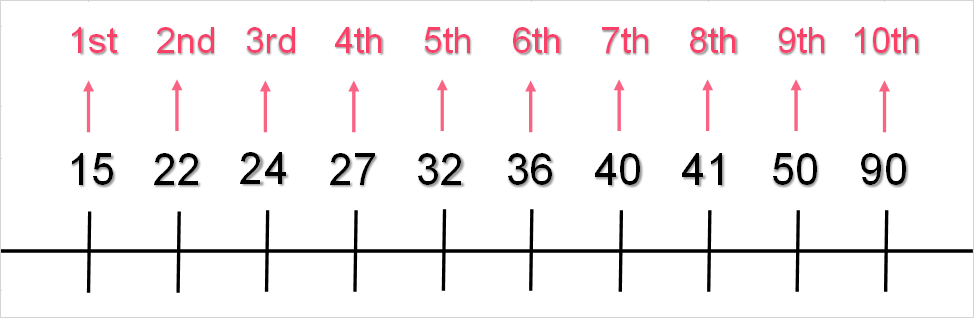
Using our previous example, we divide our data into 10 groups, each containing 10% of the data. This can be visualized in the data above. Because our n is equal to 10, each decile contains only 1 score.
The 1st decile = 15. This score, at the 1st decile, is at the 10th percentile. Meaning, 10% of students scored below this number. This doesn’t really have much meaning here because there’s only 1 value at the 1st decile - however, it can be interpreted for data sets with larger sample sizes.
The 6th decile = 36. This score, at the 6th decile, is at the 60th percentile, meaning that 60% of students scored below this number.
Problem 1: Finding Deciles and Percentiles
Using the first example, fill in the rest of the table with the corresponding deciles and percentiles.
| Decile | Percentile | Score |
| 1st | 10th | 15 |
| 22 | ||
| 24 | ||
| 27 | ||
| 32 | ||
| 6th | 60th | 36 |
| 40 | ||
| 41 | ||
| 50 | ||
| 90 |
Solution to Problem 1
You should obtain the following result:
| Decile | Percentile | Score |
| 1st | 10th | 15 |
| 2nd | 20th | 22 |
| 3rd | 30th | 24 |
| 4th | 40th | 27 |
| 5th | 50th | 32 |
| 6th | 60th | 36 |
| 7th | 70th | 40 |
| 8th | 80th | 41 |
| 9th | 90th | 50 |
| 10th | 100th | 90 |
What are Quartiles?
Similar to deciles, quartiles are a form of percentiles. While deciles split the data into 10 “buckets,” quartiles split them into quarters. A good way of remembering this is that “deci” means a tenth, whereas quartile sounds similar to quarter, which is a fourth.
Splitting our data set into quarters, gives us the following.
| Quartile | Percentile | Score |
| 15 | ||
| 22 | ||
| Quartile 1 | 25th | 24 |
| 27 | ||
| Quartile 2 | 50th | 32 |
| Quartile 2 | 36 | |
| 40 | ||
| Quartile 3 | 75th | 41 |
| 50 | ||
| 90 |
Which is easier to understand when visualized:

From the image above, we can see that each quartile, or “bucket” contains 25% of our data. The score 24 is at the 25th percentile, which means that 25% of students scored below this score. The reason why this is at the 25th percentile and not the 30th percentile this time is because half of the score belongs to the first quartile and half belongs to the second.
The second quartile is also known as the median, which, as we calculated earlier, is 34 points. Quartile 3 is the 75th percentile, which means that at 41 points, 25% students scored above and 75% of students scored below this number.
The properties of quartiles are noted below.
| Quartile | Other names for this quartile | Percentile equivalent |
| 1st quartile |
| 25th |
| 2nd quartile |
| 50th |
| 3rd quartile |
| 75th |
| 4th quartile |
| 100th |
Did you like this article? Rate it!


Can you help me answer my activities