Chapters


Function

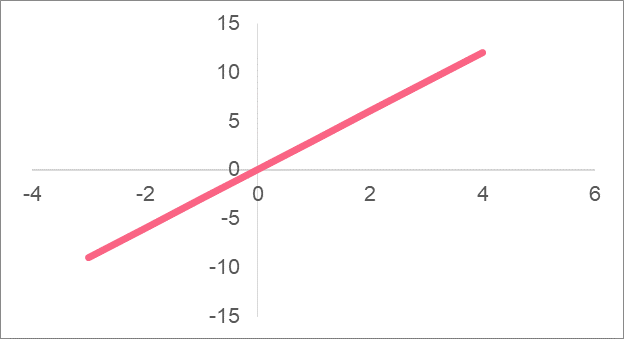
As you can see, the minimum and maximum of the line depend simply on the first and the last point we choose to plot. For many functions, finding the minimum and maximum can be harder.
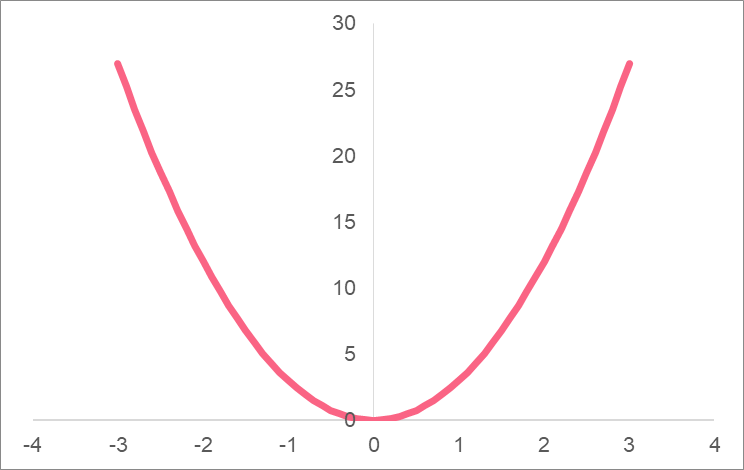
Let’s take a parabola as an example.

The image above shows an example of an equation of a parabola. Plugging the numbers in for this equation, we get the following y values.
| x | y |
| -3 | 27 |
| -2 | 12 |
| -1 | 3 |
| 0 | 0 |
| 1 | 3 |
| 2 | 12 |
| 3 | 27 |
Here, it is easy to see that the minimum of this parabola is at the point (0,0).
However, when we have more complex functions, it’s not practical to plot out every point we can think of to find the minimum or maximum.
Minimum and Maximum
Another thing you need to think of when trying to find the minimum and maximum is to understand what kind of minimum or maximum you’d like to find. When it comes to functions, there are two types of minimum and maximum.
| Absolute minimum and maximum | A function has only one absolute minimum and maximum | The top-most and bottom-most points on the graph |
| Relative extrema | A function can have many relative extrema | All the top-most and bottom-most points between absolute extrema |
Just a quick note - when we talk about more than one minimum or maximum, we use the plural form: minima and maxima. Likewise, extrema are simply more than one ‘extreme’ value. Take a look at the following graph
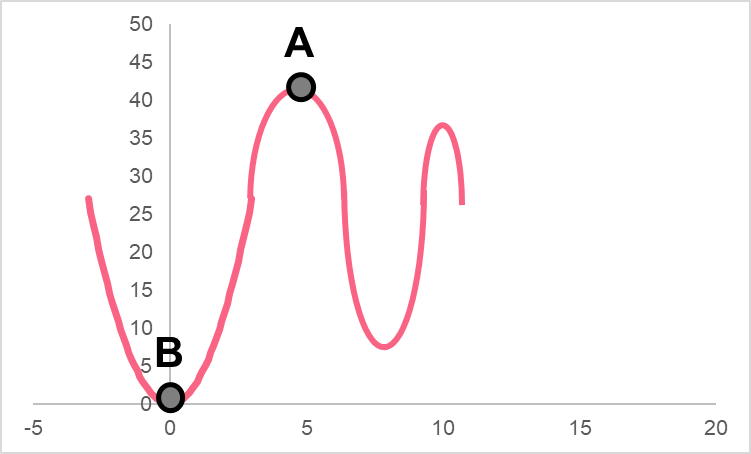
Here, you can see that there are two points that represent the absolute minimum and maximum. The lines can help you see that there are no other points that pass above or below these points.
Relative Extrema
Relative extrema, as mentioned, are all the minima and maxima that are not the absolute extrema. Keep in mind that relative extrema can also be called local extrema. We can take the previous graph as an example.
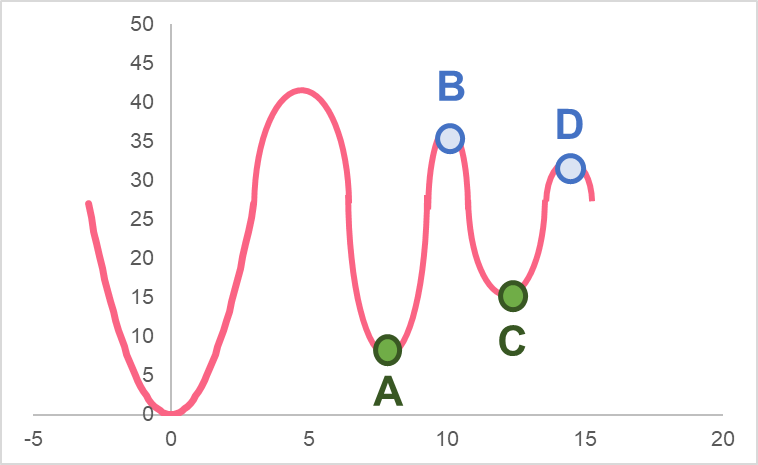
Here, we can see there are four relative extrema.
| A | Relative minimum |
| B | Relative maximum |
| C | Relative maximum |
| D | Relative minimum |
You may be wondering about the points found at the end of the line.
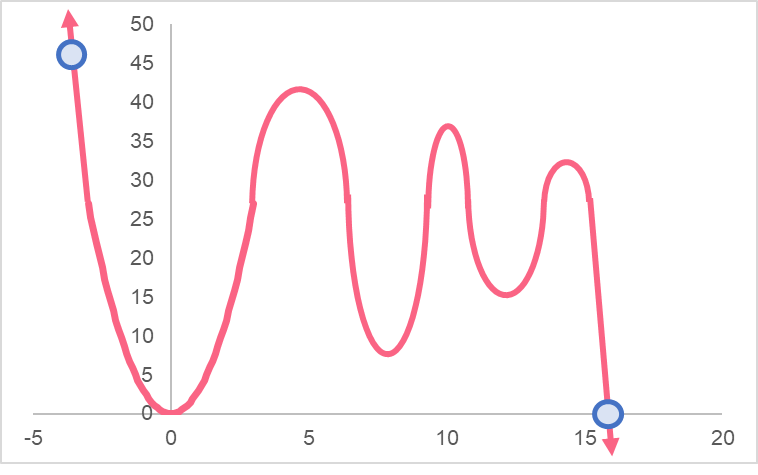
Even though these lines can keep going, we don’t take them into account in this example. This is because we have narrowed our range to only those points between the blue lines. You will often be asked to find the absolute and relative minima or maxima within a certain range.
First Derivative Test
The derivative of a function tells us the rate of change of a function. This is important in many different fields, such as finance and economics. The first derivative test allows us to locate relative and absolute minima and maxima.
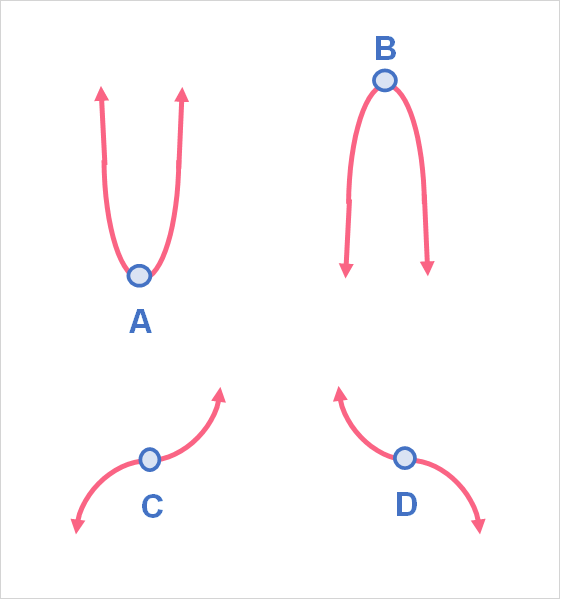
As you can see, we generally have four different scenarios in the first derivative test.
| Before the point | After the point | Result | |
| A | Decreasing | Increasing | Relative min |
| B | Increasing | Decreasing | Relative max |
| C | Increasing | Increasing | No relative max/min |
| D | Decreasing | Decreasing | No relative max/min |
The steps for performing the first derivative test, are written below, using the following formula as an example:
\[
x^{2} - 6x + 2
\]
| Step 1 | Take the first derivative | f’(x) = 2x - 6 |
| Step 2 | Set the first derivative equal to zero | 0 = 2x - 6 |
| Step 3 | Solve for x | 2x = 6 x = 6/2 = 3 |
Now, we have to figure out whether the points before and after this x value are increasing or decreasing.
| Point Before | x = 2 | f’(2) = 2(2) - 6 = -2 | Decreasing |
| Point | x = 3 | 0 | |
| Point After | x = 4 | f’(x) = 2(4) - 6 = 2 | Increasing |
Now we can see that the point is clearly a relative minimum, as the points before it decreases while the points above it increase.
Problem 1
Graph the following equation. After graphing the equation, identify which points are relative or absolute minima and maxima.

Problem 2
The most important part about the first derivative test is knowing how to take the first derivative of a function. Take the first derivative of the following functions.
| A | 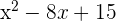 |
| B |  |
| C |  |
Problem 3
Conduct a first derivative on the following equation:
\[
3x^{3} + 4x
\]
After finding the local minima or maxima, plot them on a graph.
Solution Problem 1
In this problem, we were asked to visually identify the possible maxima or minima and state whether they are relative or absolute.
Based on this graph, we have the following answers:
| A | Relative minimum | While it is a relative minimum between the start of the line and B, it is not the lowest minimum in the entire interval |
| B | Absolute maximum | The highest point on the graph in the interval |
| C | Relative minimum | While it is a relative minimum between points B and D, it is not the lowest minimum in the entire interval |
| D | Relative maximum | While it is a relative maximum between points C and E, it is not the biggest maximum in the entire interval |
| E | Absolute minimum | The lowest point on the graph in the interval |
Solution Problem 2
In this problem we were asked to find the first derivative of each function. Take a look at the answers below.
| Function | First Derivative | |
| A | |  |
| B | |  |
| C | | 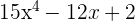 |
Solution Problem 3
We were asked to conduct a first derivative test on the following.
\[
3x^{3} + 3x
\]
First, we take the first derivative:

Next, we set this equal to zero to find the local extrema.
\[
0 = 9x^{2} + 3x
\]
\[
0 = 9x^{2} + 3x
\]
\[
0 = x(9x + 3)
\]
Here we get two roots:
- x = 0
- 0 = 9x + 3 -> x =

Now check the points before and after.
| Point Before | Point After | Result | |
| 0 |  + 3(-1) = 12 + 3(-1) = 12 |  + 3(1) = 39 + 3(1) = 39 | No relative extrema |
| + 3(-1) = 12 |  + 3(0) = 0 + 3(0) = 0 | No relative extrema |
Now we plot the function.

Did you like this article? Rate it!


