Chapters


Linear Function

As you can see from the image above, the function takes the input and makes some transformations on it, giving us the output. Now, let’s see why a linear function has the word ‘linear’ in it. Take the following function as an example.

You can think of f(x) as y. Let’s go ahead and plug some numbers into this function.
| x | f(x) |
| 0 | 1 |
| 1 | 4 |
| 2 | 7 |
| 3 | 10 |
| 4 | 13 |
| 5 | 16 |
As you can see, this is a function because it transforms the input and gives us a single output. Now, let’s plot the output.

As you can see, these two elements - the input and the output - have a linear relationship. Linear relationships are characterised by a straight-line.
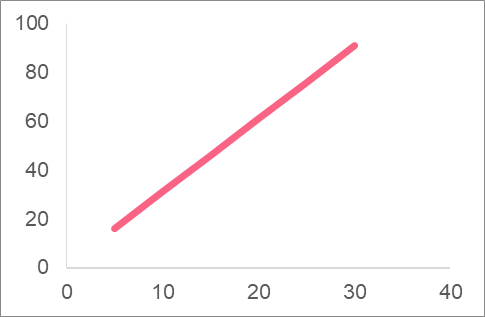

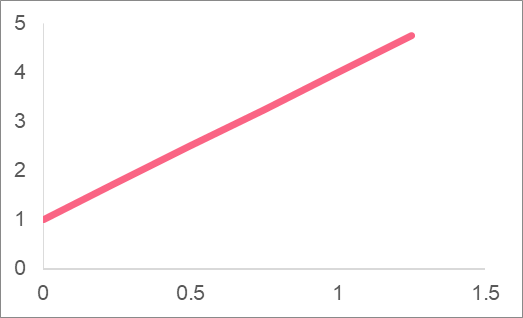
The images above are all examples of linear relationships. What changes the position and the angle of the straight line are called the y-intercept and slope.
Slope
To understand the slope of a line, you should first understand the general equation for linear equations.

The image above shows the form that all linear functions take. You’ve already seen that x is the input and f(x) is the output. Now, we can take a look at the slope, which is represented by the ‘m.’

You can think of the slope of the line as dictating how steep the line will be. The slope is usually defined as the ‘rise over run,’ which is the amount that x rises or falls and the amount x runs left or right.

Take the following slopes.
| Slope | As a fraction | Rise or Fall | Left or Right |
| 2 |  | Rise 2 | Right 1 |
| -1 |  | Fall -1 | Right 4 |
 |  | Rise 1 | Left -4 |
Now, let's see how these slopes affect the same line.

Intercept
The intercept of a linear function can be one of the most interesting bits of information that the function gives us, depending on the situation. The definition of a y-intercept is the location where the linear function crosses the y-axis. Take a look at the points in the graph below.
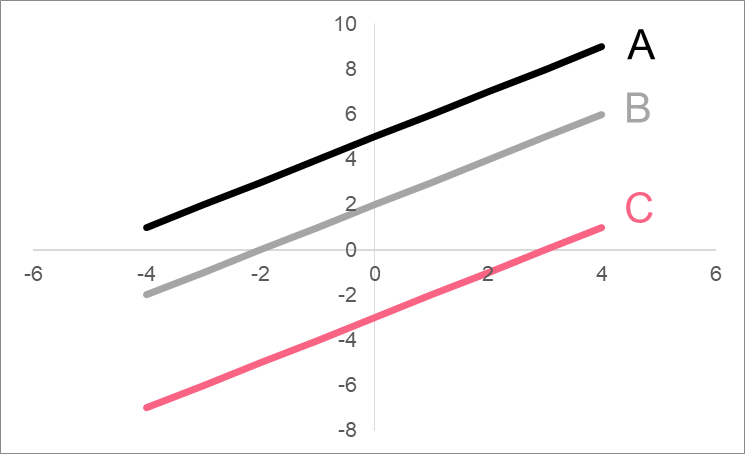
Notice what all these points have in common? The ‘x’ coordinate in each is equal to zero. This means that when x is zero, y is equal to the corresponding point - or the y-intercept.
The linear functions corresponding to each of the points are below.
| A | (0,5) | y = x + 5 |
| B | (0,2) | y = x + 2 |
| C | (0,-3) | y = x - 3 |
Input Variable
While linear functions can take on many different forms, there are two things that will always be present in a linear function: an output variable (y). An input variable is optional.
The most basic linear function has only these two variables. When we add anything else to the equation, you can think of it as a transformation on the line.
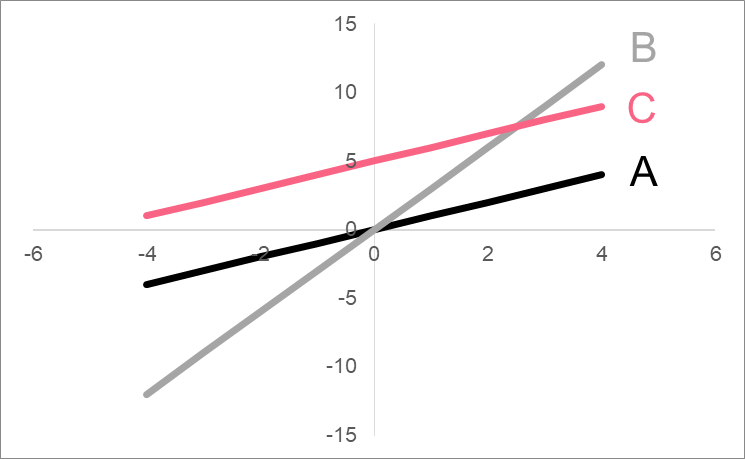
| A | y = x | One to one relationship |
| B | y = 3x | Makes the slope of the line steeper. If negative, decreasing; if positive, increasing. |
| C | y = x + 5 | Shifts the slope of the line up if y-intercept is positive, down if negative |
Problem 1
Graph the following equation and explain what it means.
\[
y = 3
\]
Problem 2
From the points shown below, find the intercept and the slope of the function, as well as the function itself.
| x | y |
| -2 | 1 |
| -1 | 3 |
| 0 | 5 |
| 1 | 7 |
| 2 | 9 |
Problem 3
Given the following two equations, explain the transformation that happens when we go from line A to line B.
| A | y = 2x + 1 |
| B | y = -2x + 2 |
Problem 4
Given these two points on the same line, find the function of the line.
- Point 1: (2,5)
- Point 2: (6,7)
Solution Problem 1
In this problem, we were given the following function and asked to graph it, as well as explain what it means.
\[
y = 3
\]
Because there is no input, or ‘x’, variable here, we will have a constant line.
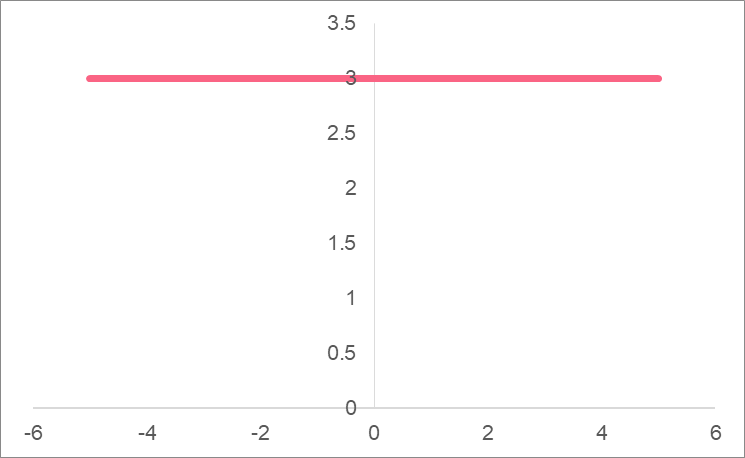
If we pretend for a moment that we have an input variable x, we can look at every point where x is supposed to be equal to a number. At x = 0, we have y = 3. At x = 1, we have y = 3. No matter what number x would be, we would always have y = 3. Almost as if the x wasn’t even there, because it isn’t!
Solution Problem 2
In this problem, we were given the following points and asked to find the function.
| x | y |
| -2 | 1 |
| -1 | 3 |
| 0 | 5 |
| 1 | 7 |
| 2 | 9 |
First, we know the y-intercept is at the point where x=0. So the y-intercept is 5. Next, we find the slope taking any two points and using the equation.
\[
m = \frac{(y_{1} - y_{2})}{(x_{1} - x_{2})} = \frac{(5 - 7)}{(0 - 1)} = 2
\]
Putting it all together, this linear function is:
\[
y = 2x + 5
\]
Solution Problem 3
In this problem, we were given two equations and asked to explain the transformations that are happening. We start with line A and go to line B.
| A | y = 2x + 1 |
| B | y = -2x + 2 |
Let’s look at the slope first. The slope decides the steepness and direction of the line. The only thing that changed from line A to B was the sign, which is now negative. This means that instead of increasing from left to right, the line is now decreasing.
The y-intercept, on the other hand, tells us whether the line shifts up or down. The line has shifted up by 1.

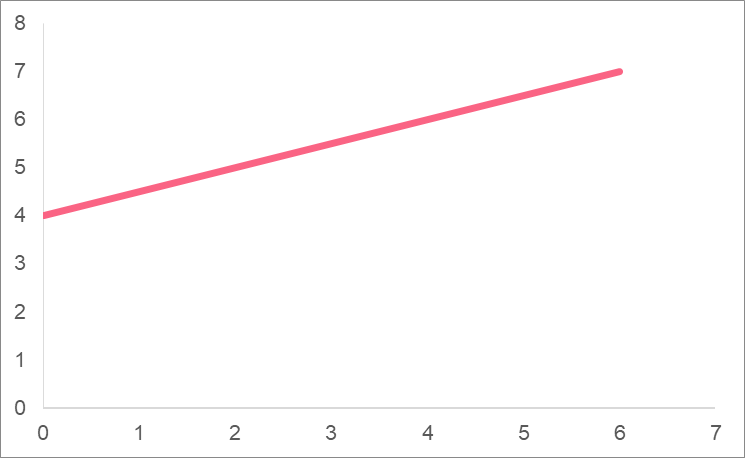
Solution Problem 4
We were asked to find the function of the line with these two points.
- Point 1: (2,5)
- Point 2: (6,7)
First, we find the slope of the line.
\[
m = \frac{(y_{1} - y_{2})}{(x_{1} - x_{2})} = \frac{(7 - 5)}{(6 - 2)} = \frac{2}{4} = \frac{1}{2}
\]
Now, we know the y-intercept is at the point of the line where x = 0. So, we plug any of the given points into the equation for a line and solve for y.
\[
5 = \frac{1}{2}(2) + b
\]
\[
5 = 1 + b
\]
\[
5 = 1 + b
\]
\[
4 = b
\]
Now we put it all together:
\[
y = \frac{1}{2}x + 4
\]
Did you like this article? Rate it!


