Chapters
The process of finding derivatives is known as differentiation. Derivative is the instantaneous rate of change of a function at a specific point. We can use various derivative rules and formulas to calculate the derivatives of the functions. Since the derivative of the function tells us the rate of change of a function at a specific point, therefore the application of derivatives are numerous in our everyday life.
Consider the function y = f(x) and consider two points on the x-axis "a" and "a + h", with "h" being a real number that corresponds to the increase of x (Δx).

The rate of change of a function on the interval [a, a + h], denoted by Δy is the difference between the ordinates corresponding to points on the x-axis, a and a + h.
Δy = [f(a+h) − f(a)]
We can find out the unknown value of the function at a given point using the value which is already known.


Average Rate of Change
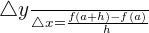
Average rate of change in the interval [a, a + h] is represented by  or
or  , and is the quotient between rate of change and the amplitude of the interval considered on the horizontal axis, h or Δx. It can be written as follows:
Geometric Interpretation
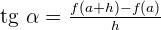
The previous expression coincides with the slope of the secant line to the function f(x), that passes through the points P and Q (represented on the graph above) which are represented on the x-axis as a and a + h.

In the triangle PQR, we can see that:
Example 1
Calculate the average rate of change of the function f(x) = x² − x in the interval [1,4].
Solution
Use the following formula to calculate the average rate of change of the function:

Find f (4) by substituting 4 in the original function  .
.
Substitute 12 and 0 in the formula to get the following final answer:
= 
Example 2
A stock market index increased from 1,350 to 1,510 points in one year. Find the average monthly rate of change.
Solution
In the above example, the stock market index is the dependent variable and months are the independent variable. Thus, we can write the above points in pairs like this:

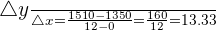
Since slope of the function is rate of change of the y - variable with respect to x - variable, therefore we will use this formula to solve this problem. The formula for slope of the function is 
Example 3
Calculate the average rate of change of the function  in the interval [3,2].
Solution
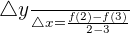
Use the following formula to calculate the average rate of change of the function:
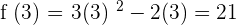
Find f (4) by substituting 4 in the original function  .
.
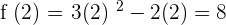
Substitute 21 and 8 in the formula to get the following final answer:
= 
Example 4
Suppose that the distance covered by a car in 3 hours is given by a function  . What is the average rate of change of the speed of the car from t = 1 to t = 3.
Solution
The average speed of the car is calculated by dividing the total distance by time. We need to find D(1) and D(3) to calculate the average speed of the car.

Now, find D(3) by substituting 3 in the original distance function like this:
= 
= 
The average rate of change is equal to the total change in distance divided by the total change in time:
= 
= 
Example 5
Calculate the average rate of change of the function  in the interval [1,2].
Solution
Use the following formula to calculate the average rate of change of the function:
Find f (2) by substituting 2 in the original function .


Substitute 12 and 3 in the formula to get the following final answer:
= 
Example 6
The cost of production of a factory has increased from 5 million to 9 million dollars in five months. Find the average monthly rate of change.
Solution
In the above example, cost of production is the dependent variable and months are the independent variable. Thus, we can write the above points in pairs like this:

Since slope of the function is rate of change of the y - variable with respect to x - variable, therefore we will use this formula to solve this problem. The formula for slope of the function is

= 1.25 million dollars
Example 7
John has boarded a train to go to home from his university. After a 30 minutes drive, he is 75 miles away from his university. After 4 hours, he is 147 miles away from his university. What is the average rate of change between these times?
Solution
Use the derivative formula  to solve this question.
Here, 


 \lim _ {h \rightarrow 0} \frac { f(4) - f (0.5)} {3.5}
Here, f (4) = 147 and f ( 0.5) = 75. Substitute these values in the above formula:
\lim _ {h \rightarrow 0} \frac { 147 - 75} {3.5}
= 20. 6 miles per hour
Example 8
Suppose that the distance covered by a car in 5 hours is given by a function  . What is the average rate of change of the speed of the car from t = 3 to t = 6.
Solution
The average speed of the car is calculated by dividing the total distance by time. We need to find D(3) and D(6) to calculate the average speed of the car.

Now, find D(6) by substituting 6 in the original distance function like this:
= 
= 
The average rate of change is equal to the total change in distance divided by the total change in time:
= 
= 
Example 9
Calculate the average rate of change of the function  in the interval [3, 4].
Solution
Use the following formula to calculate the average rate of change of the function:

Find f (3) by substituting 3 in the original function  .
.


Substitute 36 and 24 in the formula to get the following final answer:
= 
Did you like this article? Rate it!


Like the explanation, want to rearn more. Really enjoying the documents received.